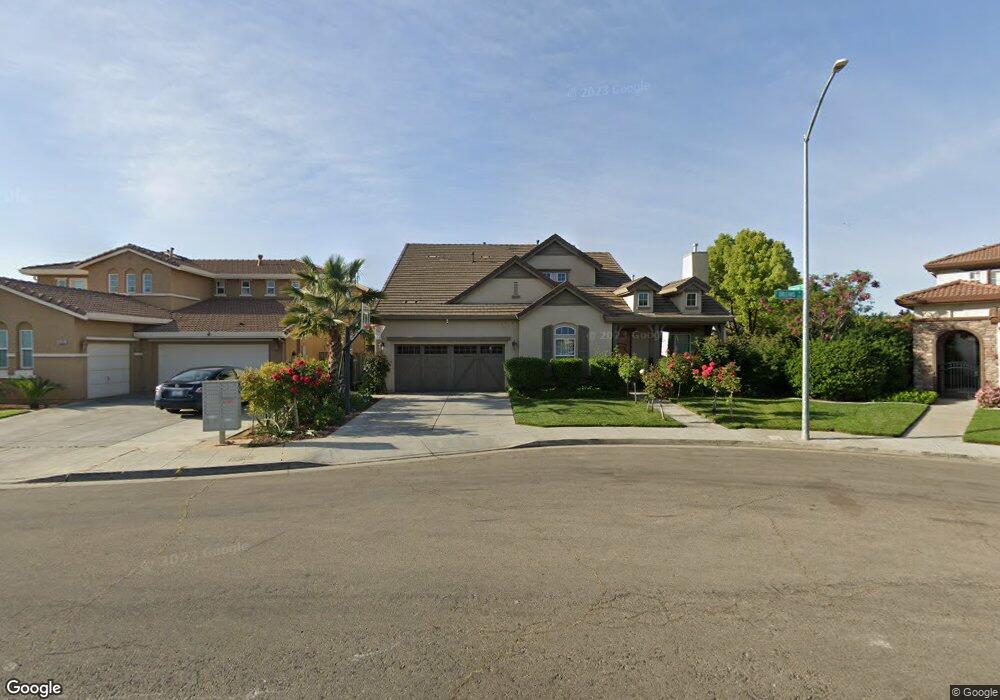
6563 E Orleans Ave Fresno, CA 93727
Sunnyside NeighborhoodEstimated Value: $296,000 - $726,000
6
Beds
5
Baths
3,110
Sq Ft
$180/Sq Ft
Est. Value
About This Home
This home is located at 6563 E Orleans Ave, Fresno, CA 93727 and is currently estimated at $560,465, approximately $180 per square foot. 6563 E Orleans Ave is a home located in Fresno County with nearby schools including John S. Wash Elementary School, Washington Academic Middle School, and Sanger High School.
Ownership History
Date
Name
Owned For
Owner Type
Purchase Details
Closed on
Jan 5, 2021
Sold by
Sandoval Rigoberto and Sandoval Maria
Bought by
Sandoval Rigoberto and Sandoval Del Rosario
Current Estimated Value
Purchase Details
Closed on
Apr 15, 2009
Sold by
Fresno Lt Ventures I Llc
Bought by
Sandoval Rigoberto and Sandoval Maria
Home Financials for this Owner
Home Financials are based on the most recent Mortgage that was taken out on this home.
Original Mortgage
$260,200
Outstanding Balance
$165,193
Interest Rate
5.02%
Mortgage Type
FHA
Estimated Equity
$395,272
Purchase Details
Closed on
Sep 29, 2008
Sold by
Iota Six Llc
Bought by
Fresno Lt Ventures I Llc
Home Financials for this Owner
Home Financials are based on the most recent Mortgage that was taken out on this home.
Original Mortgage
$3,210,900
Interest Rate
6.43%
Mortgage Type
Unknown
Purchase Details
Closed on
May 6, 2008
Sold by
Lafferty Gdci Fresno Lp
Bought by
Iota Six Llc
Create a Home Valuation Report for This Property
The Home Valuation Report is an in-depth analysis detailing your home's value as well as a comparison with similar homes in the area
Home Values in the Area
Average Home Value in this Area
Purchase History
| Date | Buyer | Sale Price | Title Company |
|---|---|---|---|
| Sandoval Rigoberto | -- | None Available | |
| Sandoval Rigoberto | $265,000 | First American Title Company | |
| Fresno Lt Ventures I Llc | -- | First American Title Company | |
| Iota Six Llc | $11,500,000 | Accommodation |
Source: Public Records
Mortgage History
| Date | Status | Borrower | Loan Amount |
|---|---|---|---|
| Open | Sandoval Rigoberto | $260,200 | |
| Previous Owner | Fresno Lt Ventures I Llc | $3,210,900 |
Source: Public Records
Tax History Compared to Growth
Tax History
| Year | Tax Paid | Tax Assessment Tax Assessment Total Assessment is a certain percentage of the fair market value that is determined by local assessors to be the total taxable value of land and additions on the property. | Land | Improvement |
|---|---|---|---|---|
| 2025 | $4,327 | $341,244 | $77,259 | $263,985 |
| 2023 | $4,253 | $327,995 | $74,260 | $253,735 |
| 2022 | $4,166 | $321,564 | $72,804 | $248,760 |
| 2021 | $4,122 | $315,260 | $71,377 | $243,883 |
| 2020 | $3,999 | $312,029 | $70,646 | $241,383 |
| 2019 | $3,902 | $305,911 | $69,261 | $236,650 |
| 2018 | $3,757 | $299,913 | $67,903 | $232,010 |
| 2017 | $3,660 | $294,033 | $66,572 | $227,461 |
| 2016 | $3,481 | $288,268 | $65,267 | $223,001 |
| 2015 | $3,574 | $283,939 | $64,287 | $219,652 |
| 2014 | $3,548 | $278,378 | $63,028 | $215,350 |
Source: Public Records
Map
Nearby Homes
- 6825 E Braly Ave
- 810 S Cypress Ave
- 6671 E Lane Ave
- 6288 E Woodward Ave
- 6259 E Liberty Ave
- 6798 E Raco Ave
- 6753 E Alta Ave
- 284 S Temperance Ave
- 6601 E Liberty Ave
- 6186 E Lane Ave
- 6856 E Geary St
- 6154 E Alta Ave
- 5976 E Butler Ave
- 1904 S Fairway Ave
- 6407 E Inyo St
- 6229 E Balch Ave
- 2163 S Bundy Dr
- 1412 S Temperance Ave
- 153 N Bliss Ave
- 6164 E Church Ave
- 6575 E Orleans Ave
- 6551 E Orleans Ave
- 6586 E Harwood Ave
- 6574 E Harwood Ave
- 6598 E Harwood Ave
- 625 S Shelly Ave
- 6560 E Harwood Ave Unit 58
- 6560 E Harwood Ave
- 6587 E Orleans Ave
- 6610 E Harwood Ave Unit 62
- 6572 E Orleans Ave
- 617 S Shelly Ave
- 656 S Filbert Ave Unit 56
- 656 S Filbert Ave
- 644 S Filbert Ave
- 6599 E Orleans Ave Unit 31
- 6599 E Orleans Ave
- 6586 E Orleans Ave Unit 27
- 636 S Filbert Ave
- 6618 E Harwood Ave Unit 63