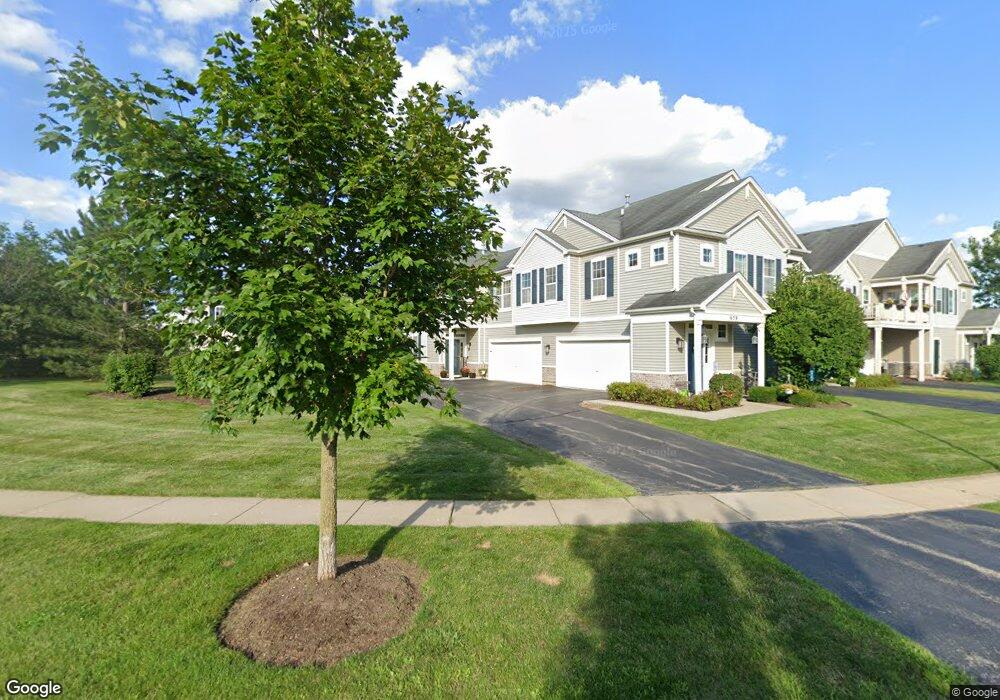
657 Arbor Cir Unit 8148 Lakemoor, IL 60051
Estimated Value: $239,000 - $255,000
--
Bed
3
Baths
1,646
Sq Ft
$149/Sq Ft
Est. Value
About This Home
This home is located at 657 Arbor Cir Unit 8148, Lakemoor, IL 60051 and is currently estimated at $245,842, approximately $149 per square foot. 657 Arbor Cir Unit 8148 is a home located in McHenry County with nearby schools including Hilltop Elementary School, Chauncey H Duker School, and Mchenry Middle School.
Ownership History
Date
Name
Owned For
Owner Type
Purchase Details
Closed on
Jul 2, 2021
Sold by
Kassulat Dawn Marie
Bought by
Nowotnik Federkins Marianne and Federkins Joseph F
Current Estimated Value
Home Financials for this Owner
Home Financials are based on the most recent Mortgage that was taken out on this home.
Original Mortgage
$105,000
Outstanding Balance
$95,271
Interest Rate
2.9%
Mortgage Type
New Conventional
Estimated Equity
$150,571
Purchase Details
Closed on
Dec 24, 2015
Sold by
Aguilar Schultz Crystal Ann Marie
Bought by
Kassulat Dawn Marie
Purchase Details
Closed on
Aug 9, 2007
Sold by
Neumann Homes Inc
Bought by
Schultz Eric S and Aguilar Crystal A
Home Financials for this Owner
Home Financials are based on the most recent Mortgage that was taken out on this home.
Original Mortgage
$149,726
Interest Rate
6.71%
Mortgage Type
Unknown
Create a Home Valuation Report for This Property
The Home Valuation Report is an in-depth analysis detailing your home's value as well as a comparison with similar homes in the area
Home Values in the Area
Average Home Value in this Area
Purchase History
| Date | Buyer | Sale Price | Title Company |
|---|---|---|---|
| Nowotnik Federkins Marianne | $155,000 | Precision Title Company | |
| Kassulat Dawn Marie | $137,987 | Precision Title Co | |
| Schultz Eric S | $187,158 | Chicago Title |
Source: Public Records
Mortgage History
| Date | Status | Borrower | Loan Amount |
|---|---|---|---|
| Open | Nowotnik Federkins Marianne | $105,000 | |
| Previous Owner | Schultz Eric S | $149,726 |
Source: Public Records
Tax History Compared to Growth
Tax History
| Year | Tax Paid | Tax Assessment Tax Assessment Total Assessment is a certain percentage of the fair market value that is determined by local assessors to be the total taxable value of land and additions on the property. | Land | Improvement |
|---|---|---|---|---|
| 2024 | $5,684 | $67,845 | $5,554 | $62,291 |
| 2023 | $5,522 | $60,782 | $4,976 | $55,806 |
| 2022 | $4,813 | $49,636 | $4,616 | $45,020 |
| 2021 | $4,579 | $46,225 | $4,299 | $41,926 |
| 2020 | $4,565 | $44,298 | $4,120 | $40,178 |
| 2019 | $4,505 | $42,064 | $3,912 | $38,152 |
| 2018 | $4,689 | $40,157 | $3,735 | $36,422 |
| 2017 | $4,513 | $37,688 | $3,505 | $34,183 |
| 2016 | $4,371 | $35,223 | $3,276 | $31,947 |
| 2013 | -- | $26,707 | $6,423 | $20,284 |
Source: Public Records
Map
Nearby Homes
- 336 Rosedale Dr
- 28808 Blacksmith Ct
- 0 Rand Rd
- 132 Rand Rd
- 191 Drydock
- 147 Rusty Scupper
- 803 East Blvd
- 28621 Wagon Trail Rd
- 31918 Hillside Dr
- 28501 Wagon Trail Ct
- 1008 W Dale Ave
- 312 N Cresthill Ave
- 27 Oyster Bay
- 32018 Savannah Dr
- 32012 Savannah Dr
- 32006 W Savannah Dr
- 104 Morningside Dr
- 32069 Savannah Dr
- 31782 N Pineview Blvd
- 135 Lotus Dr
- 661 Arbor Cir Unit 8150
- 659 Arbor Cir Unit 8149
- 647 Arbor Cir Unit 8157
- 643 Arbor Cir Unit 8159
- 653 Arbor Cir Unit 8155
- 649 Arbor Cir Unit 8156
- 649 Arbor Cir
- 667 Arbor Cir Unit 8152
- 645 Arbor Cir Unit 8158
- 665 Arbor Cir Unit 8153
- 651 Arbor Cir Unit 8154
- 663 Arbor Cir Unit 8151
- 637 Arbor Cir
- 637 Arbor Cir Unit 2
- 639 Arbor Cir Unit 8161
- 631 Arbor Cir Unit 8164
- 629 Arbor Cir Unit 8165
- 633 Arbor Cir
- 635 Arbor Cir
- 696 Arbor Cir Unit 696