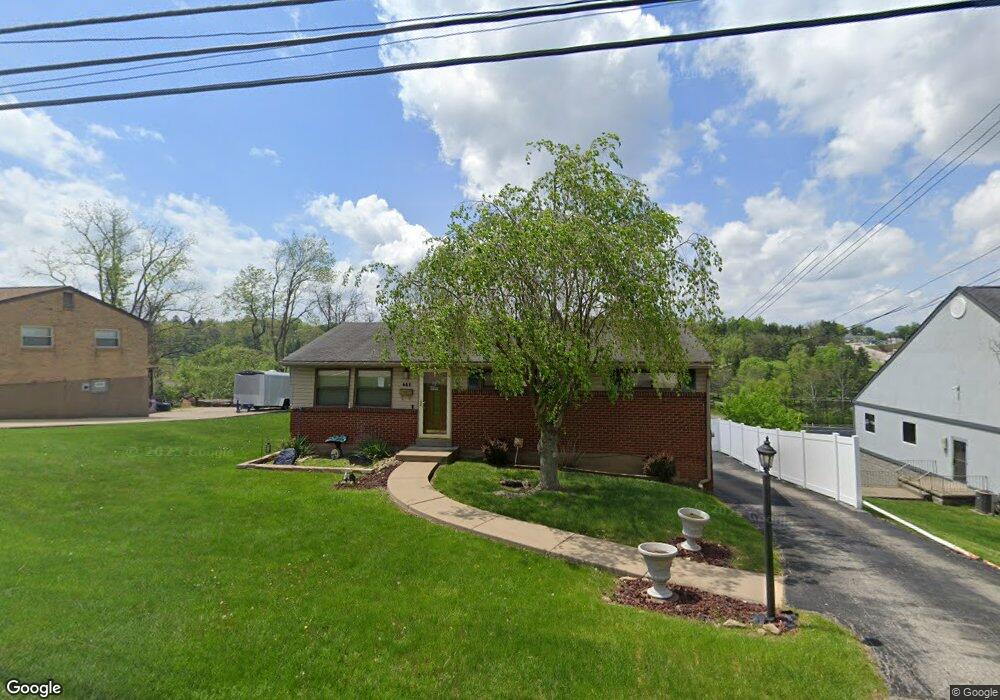
657 Arbor Ln Pittsburgh, PA 15236
Estimated Value: $196,000 - $253,000
3
Beds
2
Baths
1,000
Sq Ft
$218/Sq Ft
Est. Value
About This Home
This home is located at 657 Arbor Ln, Pittsburgh, PA 15236 and is currently estimated at $218,428, approximately $218 per square foot. 657 Arbor Ln is a home located in Allegheny County with nearby schools including McClellan Elementary School, Pleasant Hills Middle School, and Thomas Jefferson High School.
Ownership History
Date
Name
Owned For
Owner Type
Purchase Details
Closed on
Jun 16, 2022
Sold by
Kelso Edna Joann Est and Kelso Kevin Richard
Bought by
Kelso Edwin Joseph
Current Estimated Value
Purchase Details
Closed on
Jun 1, 2022
Sold by
Kelso Edwin Joseph
Bought by
Kelso Edwin Joseph
Purchase Details
Closed on
Oct 26, 2021
Sold by
Kelso Edna Joann Est and Kelso Edwin A Est
Bought by
Kelso Edwin Joseph
Purchase Details
Closed on
Oct 19, 2021
Sold by
Kelso Edwin A and Kelso Edna Joann
Bought by
Kelso Edwin A
Purchase Details
Closed on
Dec 22, 1982
Bought by
Kelso Edwin A and Edna Joann
Create a Home Valuation Report for This Property
The Home Valuation Report is an in-depth analysis detailing your home's value as well as a comparison with similar homes in the area
Home Values in the Area
Average Home Value in this Area
Purchase History
| Date | Buyer | Sale Price | Title Company |
|---|---|---|---|
| Kelso Edwin Joseph | -- | -- | |
| Kelso Edwin A | -- | -- | |
| Kelso Edwin A | $50,000 | -- | |
| Kelso Edwin Joseph | -- | -- | |
| Kelso Edwin Joseph | -- | -- |
Source: Public Records
Tax History Compared to Growth
Tax History
| Year | Tax Paid | Tax Assessment Tax Assessment Total Assessment is a certain percentage of the fair market value that is determined by local assessors to be the total taxable value of land and additions on the property. | Land | Improvement |
|---|---|---|---|---|
| 2025 | $3,499 | $93,400 | $38,100 | $55,300 |
| 2024 | $3,499 | $93,400 | $38,100 | $55,300 |
| 2023 | $3,456 | $93,400 | $38,100 | $55,300 |
| 2022 | $3,247 | $93,400 | $38,100 | $55,300 |
| 2021 | $1,166 | $93,400 | $38,100 | $55,300 |
| 2020 | $3,075 | $93,400 | $38,100 | $55,300 |
| 2019 | $3,019 | $93,400 | $38,100 | $55,300 |
| 2018 | $442 | $93,400 | $38,100 | $55,300 |
| 2017 | $2,905 | $93,400 | $38,100 | $55,300 |
| 2016 | $442 | $93,400 | $38,100 | $55,300 |
| 2015 | $442 | $93,400 | $38,100 | $55,300 |
| 2014 | $2,715 | $93,400 | $38,100 | $55,300 |
Source: Public Records
Map
Nearby Homes