
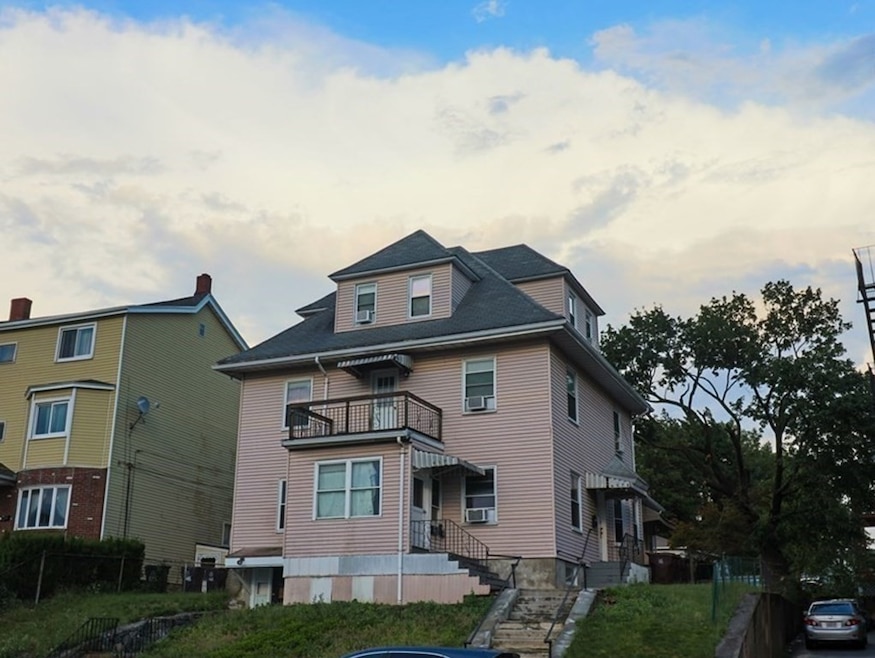
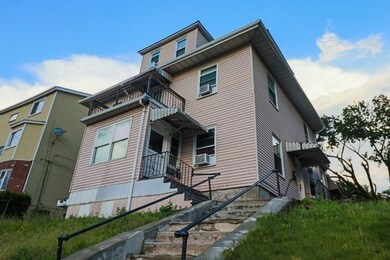

657 Broadway Everett, MA 02149
Glendale Neighborhood
8
Beds
2
Baths
2,983
Sq Ft
6,098
Sq Ft Lot
About This Home
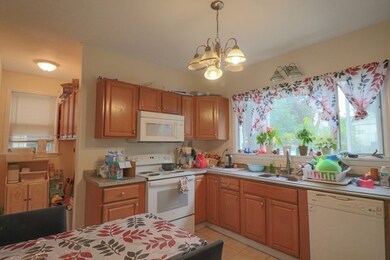
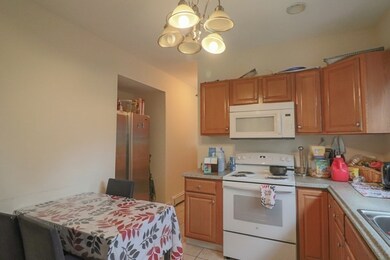
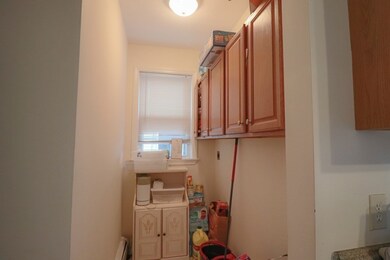
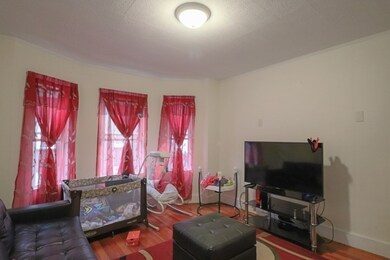
As of February 2022OPEN HOUSE CANCELLED - SUNDAY 7/11 OPEN CANCELLED DUE TO ACCEPTED OFFER. Investors and/or homeowners looking to offset their mortgage - Large, deleaded 2 family home with tons of charm! The first unit is comprised of a kitchen, living room, bedroom, and enclosed porch on the 1st floor. Unit 1 continues up to the 2nd floor with 3 additional bedrooms and a bathroom. For the second unit - the kitchen, living room & 2 bedrooms are on the second floor with 2 additional bedrooms on the third floor - one with a cedar closet. Nice sized, fenced-in yard. Two newer high-efficiency forced-hot water direct vent heating units with all new plumbing and baseboard. Water heaters were replaced last in 2014. The roof is in good condition and the home has newer windows. 100 amp electrical with owner common area panel and meter. Separate Entrance to Basement. Available for showings at open houses only. Do not rely on GPS. Between Reed Ave and Chestnut Street - across from Members Plus Credit Union
Last Buyer's Agent
Jonathan Dasilva
EVO Real Estate Group, LLC
Property Details
Home Type
- Multi-Family
Est. Annual Taxes
- $6,344
Year Built
- Built in 1925
Lot Details
- 6,098 Sq Ft Lot
Home Design
- Stone Foundation
- Frame Construction
- Shingle Roof
- Concrete Perimeter Foundation
Interior Spaces
- 2,983 Sq Ft Home
- Property has 2 Levels
- Basement Fills Entire Space Under The House
Bedrooms and Bathrooms
- 8 Bedrooms
- 2 Full Bathrooms
Parking
- On-Street Parking
- Open Parking
Outdoor Features
- Deck
- Enclosed patio or porch
Community Details
- 2 Units
- Net Operating Income $57,600
Listing and Financial Details
- Total Actual Rent $4,800
- Assessor Parcel Number 484124
Ownership History
Date
Name
Owned For
Owner Type
Purchase Details
Listed on
Jul 7, 2021
Closed on
Feb 22, 2022
Sold by
Basnet Amit and Danol Roshan
Bought by
657 Broadway Llc
Seller's Agent
Mark Gullifer
Cameron Real Estate Group - Framingham
Buyer's Agent
Jonathan Dasilva
EVO Real Estate Group, LLC
List Price
$790,000
Sold Price
$890,000
Premium/Discount to List
$100,000
12.66%
Total Days on Market
4
Current Estimated Value
Home Financials for this Owner
Home Financials are based on the most recent Mortgage that was taken out on this home.
Estimated Appreciation
$183,341
Avg. Annual Appreciation
5.90%
Original Mortgage
$630,000
Interest Rate
3.55%
Mortgage Type
Commercial
Purchase Details
Closed on
Feb 9, 2021
Sold by
Basnet Amit and Dangol Roshan
Bought by
Basnet Amit and Dangol Roshan
Home Financials for this Owner
Home Financials are based on the most recent Mortgage that was taken out on this home.
Original Mortgage
$588,200
Interest Rate
2.65%
Mortgage Type
Stand Alone Refi Refinance Of Original Loan
Purchase Details
Listed on
Jul 10, 2018
Closed on
Sep 6, 2018
Sold by
Nicholas J Bianco Ret
Bought by
Dangol Roshan and Saud Ujjal B
Seller's Agent
Renee Murray-Chakalos
Century 21 North East
Buyer's Agent
Domingo Medina
Coldwell Banker Realty - Lexington
List Price
$669,000
Sold Price
$660,000
Premium/Discount to List
-$9,000
-1.35%
Home Financials for this Owner
Home Financials are based on the most recent Mortgage that was taken out on this home.
Avg. Annual Appreciation
7.49%
Original Mortgage
$648,045
Interest Rate
4.25%
Mortgage Type
FHA
Purchase Details
Closed on
Apr 8, 2015
Sold by
Bianco Nicholas J
Bought by
Nicholas J Bianco Ret and Bianco
Purchase Details
Closed on
Sep 25, 2008
Sold by
Wells Fargo Bk
Bought by
Bianco Carol and Bianco Joseph
Home Financials for this Owner
Home Financials are based on the most recent Mortgage that was taken out on this home.
Original Mortgage
$171,000
Interest Rate
6.57%
Mortgage Type
Purchase Money Mortgage
Purchase Details
Closed on
Nov 20, 2007
Sold by
Silva Wagner F and Wells Fargo Bk
Bought by
Wells Fargo Bk
Purchase Details
Closed on
Sep 8, 2004
Sold by
Clough Barbara T
Bought by
Silva Wagner F
Map
Create a Home Valuation Report for This Property
The Home Valuation Report is an in-depth analysis detailing your home's value as well as a comparison with similar homes in the area
Similar Homes in the area
Home Values in the Area
Average Home Value in this Area
Purchase History
| Date | Type | Sale Price | Title Company |
|---|---|---|---|
| Not Resolvable | $890,000 | None Available | |
| Quit Claim Deed | -- | None Available | |
| Quit Claim Deed | -- | None Available | |
| Not Resolvable | $660,000 | -- | |
| Deed | -- | -- | |
| Deed | -- | -- | |
| Deed | $228,000 | -- | |
| Deed | $228,000 | -- | |
| Foreclosure Deed | $300,000 | -- | |
| Foreclosure Deed | $300,000 | -- | |
| Deed | $495,000 | -- | |
| Deed | $495,000 | -- |
Source: Public Records
Mortgage History
| Date | Status | Loan Amount | Loan Type |
|---|---|---|---|
| Open | $268,000 | Stand Alone Refi Refinance Of Original Loan | |
| Open | $1,300,000 | Stand Alone Refi Refinance Of Original Loan | |
| Closed | $630,000 | Commercial | |
| Previous Owner | $588,200 | Stand Alone Refi Refinance Of Original Loan | |
| Previous Owner | $648,000 | FHA | |
| Previous Owner | $648,045 | FHA | |
| Previous Owner | $284,000 | No Value Available | |
| Previous Owner | $171,000 | Purchase Money Mortgage |
Source: Public Records
Property History
| Date | Event | Price | Change | Sq Ft Price |
|---|---|---|---|---|
| 02/22/2022 02/22/22 | Sold | $890,000 | +12.7% | $298 / Sq Ft |
| 07/11/2021 07/11/21 | Pending | -- | -- | -- |
| 07/07/2021 07/07/21 | For Sale | $790,000 | +19.7% | $265 / Sq Ft |
| 09/06/2018 09/06/18 | Sold | $660,000 | -1.3% | $221 / Sq Ft |
| 07/20/2018 07/20/18 | Pending | -- | -- | -- |
| 07/10/2018 07/10/18 | For Sale | $669,000 | -- | $224 / Sq Ft |
Source: MLS Property Information Network (MLS PIN)
Tax History
| Year | Tax Paid | Tax Assessment Tax Assessment Total Assessment is a certain percentage of the fair market value that is determined by local assessors to be the total taxable value of land and additions on the property. | Land | Improvement |
|---|---|---|---|---|
| 2025 | $10,303 | $904,600 | $283,400 | $621,200 |
| 2024 | $9,421 | $822,100 | $251,900 | $570,200 |
| 2023 | $9,054 | $768,600 | $230,900 | $537,700 |
| 2022 | $7,091 | $684,500 | $220,400 | $464,100 |
| 2021 | $6,344 | $642,800 | $197,300 | $445,500 |
| 2020 | $6,667 | $626,600 | $197,300 | $429,300 |
| 2019 | $7,016 | $566,700 | $187,900 | $378,800 |
| 2018 | $6,915 | $501,800 | $163,700 | $338,100 |
| 2017 | $6,277 | $434,700 | $125,900 | $308,800 |
| 2016 | $5,797 | $401,200 | $125,900 | $275,300 |
| 2015 | $5,483 | $375,300 | $118,300 | $257,000 |
Source: Public Records
Source: MLS Property Information Network (MLS PIN)
MLS Number: 72861613
APN: EVER-000000-M000002-000001
Disclaimer: Certain information contained herein is derived from information provided by parties other than Homes.com. All information provided is deemed reliable, but is not guaranteed to be accurate and should be independently verified.
![]() The property listing data and information, or the Images, set forth herein were provided to MLS Property Information Network, Inc. from third party sources, including sellers, lessors and public records, and were compiled by MLS Property Information Network, Inc. The property listing data and information, and the Images, are for the personal, non-commercial use of consumers having a good faith interest in purchasing or leasing listed properties of the type displayed to them and may not be used for any purpose other than to identify prospective properties which such consumers may have a good faith interest in purchasing or leasing. MLS Property Information Network, Inc. and its subscribers disclaim any and all representations and warranties as to the accuracy of the property listing data and information, or as to the accuracy of any of the Images, set forth herein.
The property listing data and information, or the Images, set forth herein were provided to MLS Property Information Network, Inc. from third party sources, including sellers, lessors and public records, and were compiled by MLS Property Information Network, Inc. The property listing data and information, and the Images, are for the personal, non-commercial use of consumers having a good faith interest in purchasing or leasing listed properties of the type displayed to them and may not be used for any purpose other than to identify prospective properties which such consumers may have a good faith interest in purchasing or leasing. MLS Property Information Network, Inc. and its subscribers disclaim any and all representations and warranties as to the accuracy of the property listing data and information, or as to the accuracy of any of the Images, set forth herein.
Nearby Homes
- 8 Parker St Unit 5
- 6 Timothy Ave
- 47 Walnut St
- 111 Walnut St
- 89 Reed Ave
- 25 Maple Ave
- 749 Broadway
- 162 Chestnut St
- 128 Clarence St
- 56 Vernal St
- 16 Hampshire St
- 11 Foster St
- 12 Woodland St Unit 25
- 412 Ferry St
- 15 Staples Ave Unit 48
- 71 Summer St
- 75 Sycamore St
- 21 Central Ave Unit 36
- 10 Edith Ave Unit 3
- 78 Woodlawn St