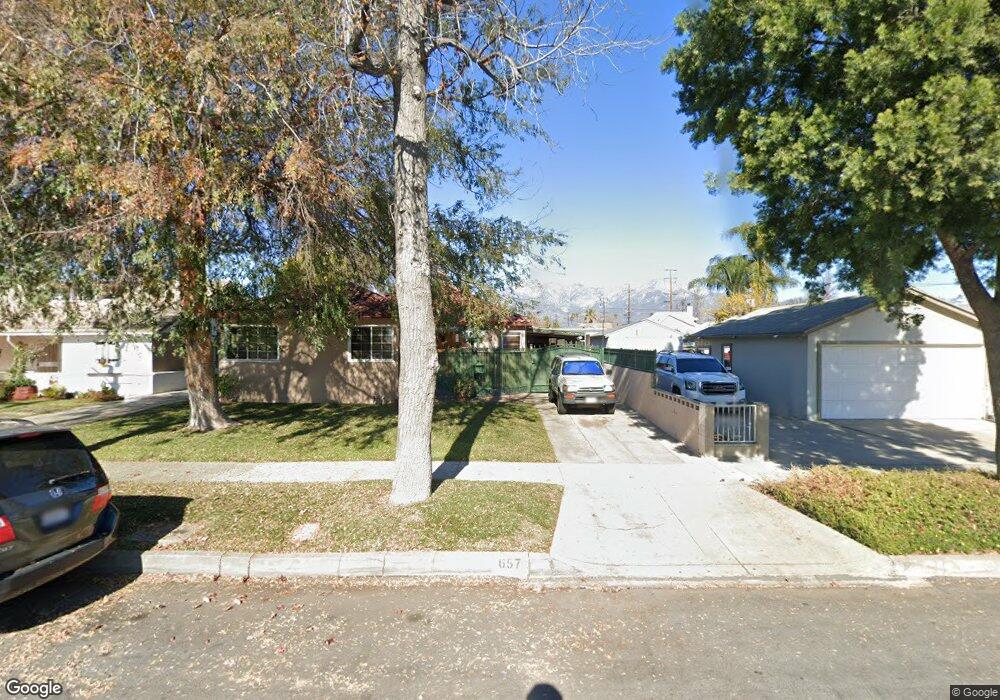
657 E Granada Ct Ontario, CA 91764
Downtown Ontario NeighborhoodEstimated Value: $609,570 - $676,000
2
Beds
1
Bath
1,271
Sq Ft
$510/Sq Ft
Est. Value
About This Home
This home is located at 657 E Granada Ct, Ontario, CA 91764 and is currently estimated at $647,643, approximately $509 per square foot. 657 E Granada Ct is a home located in San Bernardino County with nearby schools including Central Language Academy, Vina Danks Middle, and Chaffey High School.
Ownership History
Date
Name
Owned For
Owner Type
Purchase Details
Closed on
Mar 6, 1998
Sold by
Ward Glorine
Bought by
Barajas Francisco Jose and Barajas Maria Del Carmen
Current Estimated Value
Home Financials for this Owner
Home Financials are based on the most recent Mortgage that was taken out on this home.
Original Mortgage
$89,871
Outstanding Balance
$16,065
Interest Rate
7.11%
Mortgage Type
FHA
Estimated Equity
$631,578
Purchase Details
Closed on
Feb 20, 1998
Sold by
Moore David
Bought by
Barajas Francisco Jose and Barajas Maria Del Carmen
Home Financials for this Owner
Home Financials are based on the most recent Mortgage that was taken out on this home.
Original Mortgage
$89,871
Outstanding Balance
$16,065
Interest Rate
7.11%
Mortgage Type
FHA
Estimated Equity
$631,578
Create a Home Valuation Report for This Property
The Home Valuation Report is an in-depth analysis detailing your home's value as well as a comparison with similar homes in the area
Home Values in the Area
Average Home Value in this Area
Purchase History
| Date | Buyer | Sale Price | Title Company |
|---|---|---|---|
| Barajas Francisco Jose | -- | Universal Title Company | |
| Barajas Francisco Jose | -- | Universal Title | |
| Barajas Francisco Jose | -- | Universal Title Company | |
| Barajas Francisco Jose | $90,000 | Universal Title Company |
Source: Public Records
Mortgage History
| Date | Status | Borrower | Loan Amount |
|---|---|---|---|
| Open | Barajas Francisco Jose | $89,871 |
Source: Public Records
Tax History
| Year | Tax Paid | Tax Assessment Tax Assessment Total Assessment is a certain percentage of the fair market value that is determined by local assessors to be the total taxable value of land and additions on the property. | Land | Improvement |
|---|---|---|---|---|
| 2025 | $1,492 | $141,098 | $62,711 | $78,387 |
| 2024 | $1,456 | $138,331 | $61,481 | $76,850 |
| 2023 | $1,414 | $135,618 | $60,275 | $75,343 |
| 2022 | $1,394 | $132,959 | $59,093 | $73,866 |
| 2021 | $1,383 | $130,352 | $57,934 | $72,418 |
| 2020 | $1,359 | $129,015 | $57,340 | $71,675 |
| 2019 | $1,346 | $126,486 | $56,216 | $70,270 |
| 2018 | $1,325 | $124,006 | $55,114 | $68,892 |
| 2017 | $1,277 | $121,574 | $54,033 | $67,541 |
| 2016 | $1,225 | $119,191 | $52,974 | $66,217 |
| 2015 | $1,216 | $117,400 | $52,178 | $65,222 |
| 2014 | $1,177 | $115,100 | $51,156 | $63,944 |
Source: Public Records
Map
Nearby Homes
- 651 E Granada Ct
- 839 N Campus Ave
- 665 E Granada Ct
- 843 N Campus Ave
- 647 E Granada Ct
- 847 N Campus Ave
- 656 E I St
- 654 E I St
- 643 E Granada Ct
- 664 E I St
- 646 E I St
- 823 N Campus Ave
- 666 E I St
- 658 E Granada Ct
- 637 E Granada Ct
- 640 E I St
- 652 E Granada Ct
- 815 N Campus Ave
- 703 E Granada Ct
- 648 E Granada Ct
Your Personal Tour Guide
Ask me questions while you tour the home.