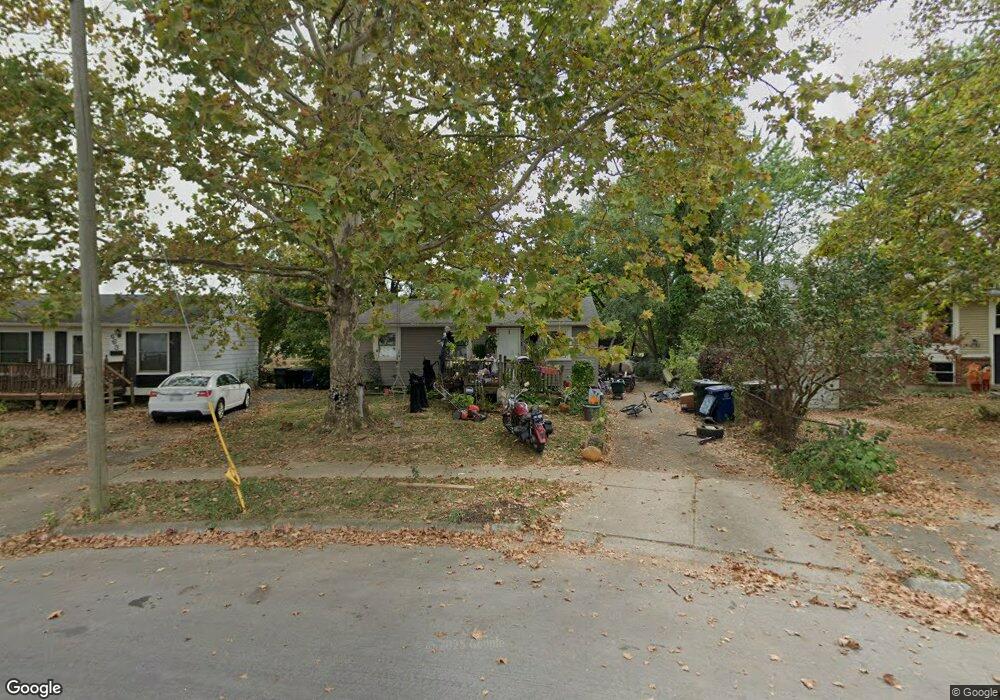
657 Redford Ave Columbus, OH 43207
Obetz-Lockbourne NeighborhoodEstimated Value: $185,539 - $216,000
3
Beds
1
Bath
1,080
Sq Ft
$185/Sq Ft
Est. Value
About This Home
This home is located at 657 Redford Ave, Columbus, OH 43207 and is currently estimated at $200,135, approximately $185 per square foot. 657 Redford Ave is a home located in Franklin County with nearby schools including Hamilton Elementary School, Hamilton Intermediate School, and Hamilton Middle School.
Ownership History
Date
Name
Owned For
Owner Type
Purchase Details
Closed on
Feb 28, 2019
Sold by
Core Developments 4 Llc
Bought by
Core Developments 2 Llc
Current Estimated Value
Home Financials for this Owner
Home Financials are based on the most recent Mortgage that was taken out on this home.
Original Mortgage
$585,600
Outstanding Balance
$448,090
Interest Rate
4.4%
Mortgage Type
Commercial
Estimated Equity
-$247,955
Purchase Details
Closed on
Sep 26, 2018
Sold by
Smith Douglas L and Smith Mauri J Bowman
Bought by
Core Developments Llc
Home Financials for this Owner
Home Financials are based on the most recent Mortgage that was taken out on this home.
Original Mortgage
$49,600
Interest Rate
4.5%
Mortgage Type
Commercial
Purchase Details
Closed on
Jan 16, 2015
Sold by
Smith Bill L and Smith Bill Lee
Bought by
Smith Douglas J and Smith Mauri J Bowman
Home Financials for this Owner
Home Financials are based on the most recent Mortgage that was taken out on this home.
Original Mortgage
$25,000
Interest Rate
4.7%
Mortgage Type
Adjustable Rate Mortgage/ARM
Purchase Details
Closed on
Feb 28, 1973
Bought by
Smith Bill L
Create a Home Valuation Report for This Property
The Home Valuation Report is an in-depth analysis detailing your home's value as well as a comparison with similar homes in the area
Home Values in the Area
Average Home Value in this Area
Purchase History
| Date | Buyer | Sale Price | Title Company |
|---|---|---|---|
| Core Developments 2 Llc | -- | Pm Title Llc | |
| Core Developments Llc | $62,000 | Pm Title Box | |
| Smith Douglas J | $22,500 | Amerititle | |
| Smith Bill L | -- | -- |
Source: Public Records
Mortgage History
| Date | Status | Borrower | Loan Amount |
|---|---|---|---|
| Open | Core Developments 2 Llc | $585,600 | |
| Previous Owner | Core Developments Llc | $49,600 | |
| Previous Owner | Smith Douglas J | $25,000 |
Source: Public Records
Tax History Compared to Growth
Tax History
| Year | Tax Paid | Tax Assessment Tax Assessment Total Assessment is a certain percentage of the fair market value that is determined by local assessors to be the total taxable value of land and additions on the property. | Land | Improvement |
|---|---|---|---|---|
| 2024 | $1,923 | $48,620 | $14,280 | $34,340 |
| 2023 | $1,893 | $48,615 | $14,280 | $34,335 |
| 2022 | $931 | $21,710 | $8,160 | $13,550 |
| 2021 | $1,081 | $21,710 | $8,160 | $13,550 |
| 2020 | $1,118 | $21,710 | $8,160 | $13,550 |
| 2019 | $1,514 | $30,070 | $8,160 | $21,910 |
| 2018 | $951 | $30,070 | $8,160 | $21,910 |
| 2017 | $1,488 | $30,070 | $8,160 | $21,910 |
| 2016 | $417 | $7,880 | $5,500 | $2,380 |
| 2015 | $579 | $7,880 | $5,500 | $2,380 |
| 2014 | $1,384 | $26,470 | $5,500 | $20,970 |
| 2013 | $710 | $27,860 | $5,775 | $22,085 |
Source: Public Records
Map
Nearby Homes
- 568 Glendora Rd
- 4141 Kershaw Dr
- 812 Breathitt Ave
- 4132 Martinsburg Dr
- 3940 Hillman Rd W
- 4125 Martinsburg Dr
- 4309 Salt Spring Ln
- 552 Harland Dr
- 0 Parsons Ave Unit 225012522
- 904 Kyle Ave
- 3714 Parsons Ave
- 312 Harland Dr
- 3735 Christie Rd W
- 3691 Ferman Rd
- 3691 Abney Rd
- 4296 Oakwind Dr
- 503 Ashwood Rd
- 525 Ashwood Rd
- 785 Scarlett Ln
- 4207 Crosspointe Dr
- 663 Redford Ave
- 4053 Aluaton St
- 669 Redford Ave
- 643 Heisley Dr
- 637 Heisley Dr
- 677 Redford Ave
- 4042 Aluaton St
- 636 Obetz Rd
- 4052 Aluaton St
- 685 Redford Ave
- 629 Heisley Dr
- 672 Redford Ave
- 628 Obetz Rd
- 655 Obetz Rd
- 678 Redford Ave
- 621 Heisley Dr
- 691 Redford Ave
- 4030 Aluaton St
- 636 Heisley Dr
- 684 Redford Ave