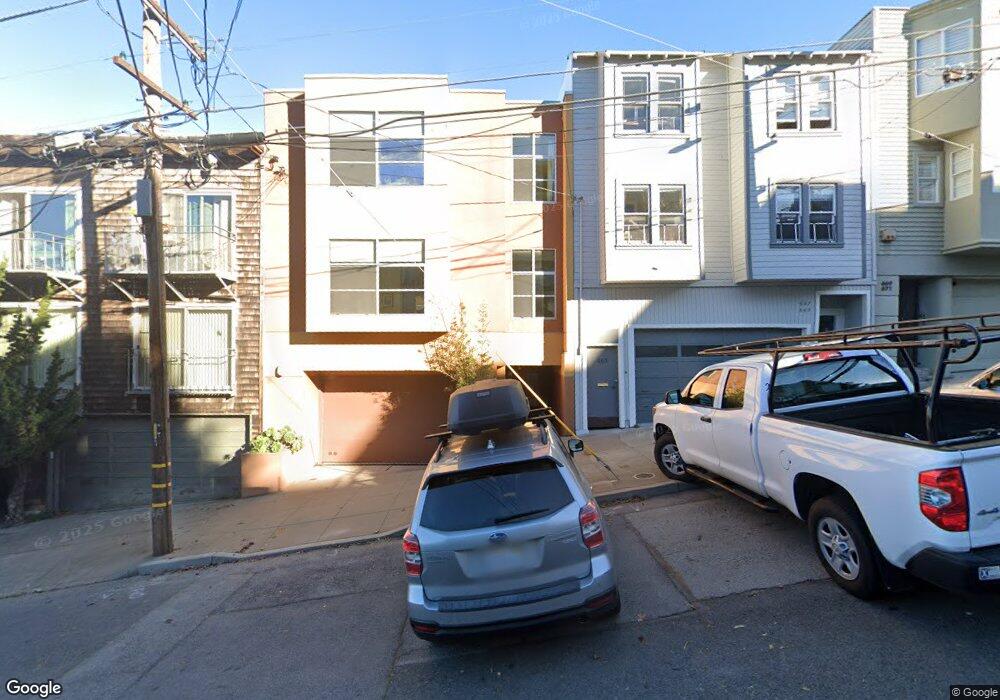
657 Rhode Island St Unit 6590 San Francisco, CA 94107
Potrero NeighborhoodEstimated Value: $1,558,000 - $2,158,000
--
Bed
--
Bath
2,349
Sq Ft
$757/Sq Ft
Est. Value
About This Home
This home is located at 657 Rhode Island St Unit 6590, San Francisco, CA 94107 and is currently estimated at $1,779,011, approximately $757 per square foot. 657 Rhode Island St Unit 6590 is a home located in San Francisco County with nearby schools including Daniel Webster Elementary School, James Lick Middle School, and The New School of San Francisco.
Ownership History
Date
Name
Owned For
Owner Type
Purchase Details
Closed on
Jan 31, 2023
Sold by
Mcinerney Thomas
Bought by
Thomas Mcinerney Living Trust
Current Estimated Value
Purchase Details
Closed on
Aug 23, 2007
Sold by
Ward John and Mertens Lisa
Bought by
Mcinerney Thomas
Home Financials for this Owner
Home Financials are based on the most recent Mortgage that was taken out on this home.
Original Mortgage
$775,000
Interest Rate
6.74%
Mortgage Type
New Conventional
Purchase Details
Closed on
Jul 7, 1994
Sold by
Edwards Zora Tyler
Bought by
Edwards Zora Tyler
Purchase Details
Closed on
Jun 16, 1994
Sold by
Edwards Zora Tyler
Bought by
Edwards Zora Tyler
Create a Home Valuation Report for This Property
The Home Valuation Report is an in-depth analysis detailing your home's value as well as a comparison with similar homes in the area
Home Values in the Area
Average Home Value in this Area
Purchase History
| Date | Buyer | Sale Price | Title Company |
|---|---|---|---|
| Thomas Mcinerney Living Trust | -- | -- | |
| Mcinerney Thomas | -- | First American Title Co | |
| Edwards Zora Tyler | -- | -- | |
| Edwards Zora Tyler | -- | -- |
Source: Public Records
Mortgage History
| Date | Status | Borrower | Loan Amount |
|---|---|---|---|
| Previous Owner | Mcinerney Thomas | $775,000 |
Source: Public Records
Tax History Compared to Growth
Tax History
| Year | Tax Paid | Tax Assessment Tax Assessment Total Assessment is a certain percentage of the fair market value that is determined by local assessors to be the total taxable value of land and additions on the property. | Land | Improvement |
|---|---|---|---|---|
| 2025 | $12,897 | $1,054,237 | $341,368 | $712,869 |
| 2024 | $12,897 | $1,033,567 | $334,675 | $698,892 |
| 2023 | $12,699 | $1,013,284 | $328,102 | $685,182 |
| 2022 | $12,452 | $993,418 | $321,670 | $671,748 |
| 2021 | $12,230 | $973,942 | $315,364 | $658,578 |
| 2020 | $12,343 | $963,958 | $312,132 | $651,826 |
| 2019 | $11,873 | $945,058 | $306,012 | $639,046 |
| 2018 | $11,474 | $926,528 | $300,012 | $626,516 |
| 2017 | $11,041 | $908,362 | $294,130 | $614,232 |
| 2016 | $10,853 | $890,554 | $288,364 | $602,190 |
| 2015 | $10,719 | $877,180 | $284,034 | $593,146 |
| 2014 | $10,437 | $860,000 | $278,472 | $581,528 |
Source: Public Records
Map
Nearby Homes
- 700 De Haro St
- 631 Carolina St
- 666 Carolina St Unit 666
- 1812 20th St
- 352 Arkansas St
- 451 Kansas St Unit 410
- 2225 Mariposa St
- 507 Potrero Ave
- 264 Missouri St
- 1002 Rhode Island St Unit 1
- 2023 22nd St
- 2119 22nd St
- 561 Connecticut St
- 573 Connecticut St
- 701 Hampshire St Unit 5
- 2625 19th St
- 312 Utah St
- 333-335 Potrero Ave
- 338 Potrero Ave Unit 206
- 338 Potrero Ave Unit 308
- 657 Rhode Island St Unit 6590
- 663 Rhode Island St Unit 667
- 671 Rhode Island St
- 669 Rhode Island St Unit 669
- 675 Rhode Island St Unit 675
- 677 Rhode Island St
- 621 Rhode Island St Unit . A
- 621 Rhode Island St
- 650 De Haro St
- 646 De Haro St
- 660 De Haro St
- 662 De Haro St
- 695 Rhode Island St
- 619 Rhode Island St
- 640 De Haro St
- 638 De Haro St
- 670 De Haro St
- 617 Rhode Island St
- 692B De Haro St
- 692 De Haro St Unit A