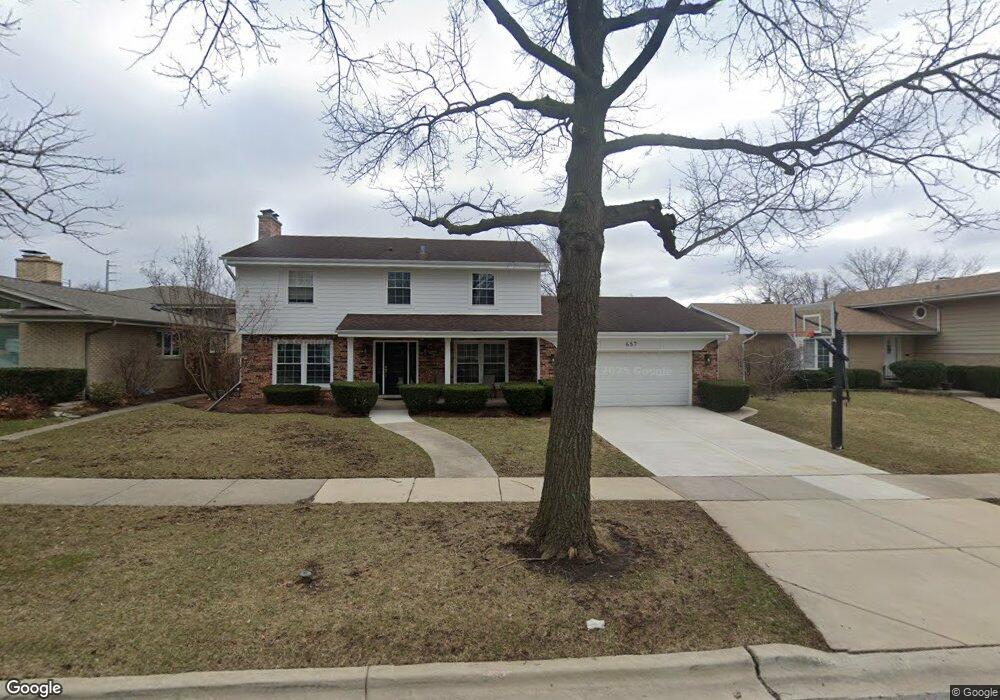
657 S Hillcrest Ave Elmhurst, IL 60126
Estimated Value: $850,518 - $933,000
4
Beds
3
Baths
2,792
Sq Ft
$319/Sq Ft
Est. Value
About This Home
This home is located at 657 S Hillcrest Ave, Elmhurst, IL 60126 and is currently estimated at $889,880, approximately $318 per square foot. 657 S Hillcrest Ave is a home located in DuPage County with nearby schools including Pulaski Intl School of Chicago, Jefferson Elementary School, and Sandburg Middle School.
Ownership History
Date
Name
Owned For
Owner Type
Purchase Details
Closed on
Apr 4, 2025
Sold by
Niederman Eric and Niederman Denise E
Bought by
Niederman Denise E
Current Estimated Value
Home Financials for this Owner
Home Financials are based on the most recent Mortgage that was taken out on this home.
Original Mortgage
$501,000
Outstanding Balance
$498,763
Interest Rate
6.62%
Mortgage Type
New Conventional
Estimated Equity
$391,117
Purchase Details
Closed on
Jun 25, 2007
Sold by
Mcgreal Martha and Estate Of Inez M Mittelstadt
Bought by
Niederman Eric and Niederman Denise
Home Financials for this Owner
Home Financials are based on the most recent Mortgage that was taken out on this home.
Original Mortgage
$417,000
Interest Rate
6.42%
Mortgage Type
Purchase Money Mortgage
Purchase Details
Closed on
Mar 30, 2005
Sold by
Mittelstadt Bruce
Bought by
Mittelstadt Bruce and The Bruce Mittelstadt Declaration Of Tr
Create a Home Valuation Report for This Property
The Home Valuation Report is an in-depth analysis detailing your home's value as well as a comparison with similar homes in the area
Home Values in the Area
Average Home Value in this Area
Purchase History
| Date | Buyer | Sale Price | Title Company |
|---|---|---|---|
| Niederman Denise E | -- | None Listed On Document | |
| Niederman Eric | $575,000 | First American Title Ins Co | |
| Mittelstadt Bruce | -- | -- |
Source: Public Records
Mortgage History
| Date | Status | Borrower | Loan Amount |
|---|---|---|---|
| Open | Niederman Denise E | $501,000 | |
| Previous Owner | Niederman Eric | $417,000 |
Source: Public Records
Tax History Compared to Growth
Tax History
| Year | Tax Paid | Tax Assessment Tax Assessment Total Assessment is a certain percentage of the fair market value that is determined by local assessors to be the total taxable value of land and additions on the property. | Land | Improvement |
|---|---|---|---|---|
| 2024 | $14,272 | $244,818 | $106,875 | $137,943 |
| 2023 | $13,258 | $226,390 | $98,830 | $127,560 |
| 2022 | $12,832 | $217,620 | $94,990 | $122,630 |
| 2021 | $12,517 | $212,210 | $92,630 | $119,580 |
| 2020 | $12,035 | $207,560 | $90,600 | $116,960 |
| 2019 | $11,786 | $197,340 | $86,140 | $111,200 |
| 2018 | $13,127 | $217,900 | $81,550 | $136,350 |
| 2017 | $12,848 | $207,640 | $77,710 | $129,930 |
| 2016 | $12,587 | $195,610 | $73,210 | $122,400 |
| 2015 | $12,473 | $182,230 | $68,200 | $114,030 |
| 2014 | $9,995 | $135,700 | $54,130 | $81,570 |
| 2013 | $9,886 | $137,610 | $54,890 | $82,720 |
Source: Public Records
Map
Nearby Homes
- 675 S Edgewood Ave
- 593 S Edgewood Ave
- 705 S Edgewood Ave
- 494 E Atwood Ct
- 505 E Atwood Ct
- 550 S Hillcrest Ave
- 341 E Madison St
- 441 E Adams St
- 427 E Adams St
- 515 S Parkview Ave
- 522 E Park Manor Ct
- 562 S Poplar Ave
- 274 E Crescent Ave
- 497 S Stratford Ave
- 613 S Chatham Ave
- 5936 W Maple Ave
- 446 S Stratford Ave
- 5844 W Maple Ave
- 353 E Butterfield Rd
- 5904 Burr Oak Ave
- 651 S Hillcrest Ave
- 663 S Hillcrest Ave
- 645 S Hillcrest Ave
- 669 S Hillcrest Ave
- 656 S Stratford Ave
- 650 S Stratford Ave
- 662 S Stratford Ave
- 658 S Hillcrest Ave
- 652 S Hillcrest Ave
- 662 S Hillcrest Ave
- 646 S Hillcrest Ave
- 646 S Stratford Ave
- 639 S Hillcrest Ave
- 675 S Hillcrest Ave
- 670 S Hillcrest Ave
- 668 S Stratford Ave Unit 2
- 640 S Hillcrest Ave
- 640 S Stratford Ave
- 674 S Stratford Ave
- 635 S Hillcrest Ave