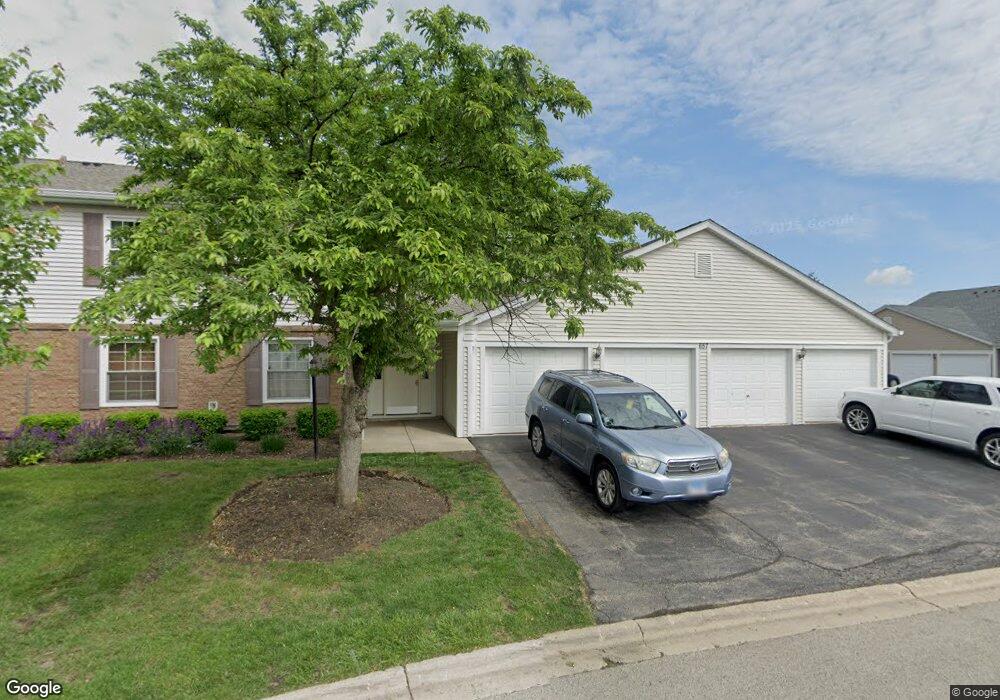
657 Thorntree Ct Unit D2 Bartlett, IL 60103
Estimated Value: $224,000 - $241,745
2
Beds
2
Baths
1,200
Sq Ft
$194/Sq Ft
Est. Value
About This Home
This home is located at 657 Thorntree Ct Unit D2, Bartlett, IL 60103 and is currently estimated at $232,686, approximately $193 per square foot. 657 Thorntree Ct Unit D2 is a home located in Cook County with nearby schools including Bartlett Elementary School, Eastview Middle School, and South Elgin High School.
Ownership History
Date
Name
Owned For
Owner Type
Purchase Details
Closed on
Jun 15, 2017
Sold by
Nguyen Jim and Galione Salvatrice
Bought by
Ciullo Brian and Jackson Ronald
Current Estimated Value
Home Financials for this Owner
Home Financials are based on the most recent Mortgage that was taken out on this home.
Original Mortgage
$95,250
Outstanding Balance
$78,655
Interest Rate
4.02%
Mortgage Type
New Conventional
Estimated Equity
$154,031
Purchase Details
Closed on
Feb 25, 2005
Sold by
Esvang Robert
Bought by
Nguyen Jim and Galione Salvatrice
Home Financials for this Owner
Home Financials are based on the most recent Mortgage that was taken out on this home.
Original Mortgage
$138,700
Interest Rate
5.7%
Mortgage Type
Unknown
Purchase Details
Closed on
May 13, 1996
Sold by
Pruyn Scott E and Pruyn Thomas A
Bought by
Esvang Robert
Home Financials for this Owner
Home Financials are based on the most recent Mortgage that was taken out on this home.
Original Mortgage
$87,100
Interest Rate
8.1%
Mortgage Type
FHA
Create a Home Valuation Report for This Property
The Home Valuation Report is an in-depth analysis detailing your home's value as well as a comparison with similar homes in the area
Home Values in the Area
Average Home Value in this Area
Purchase History
| Date | Buyer | Sale Price | Title Company |
|---|---|---|---|
| Ciullo Brian | $127,000 | Chicago Title Insurance Comp | |
| Nguyen Jim | $146,000 | Chicago Title Insurance Comp | |
| Esvang Robert | $89,500 | -- |
Source: Public Records
Mortgage History
| Date | Status | Borrower | Loan Amount |
|---|---|---|---|
| Open | Ciullo Brian | $95,250 | |
| Previous Owner | Nguyen Jim | $138,700 | |
| Previous Owner | Esvang Robert | $87,100 |
Source: Public Records
Tax History
| Year | Tax Paid | Tax Assessment Tax Assessment Total Assessment is a certain percentage of the fair market value that is determined by local assessors to be the total taxable value of land and additions on the property. | Land | Improvement |
|---|---|---|---|---|
| 2025 | $5,056 | $23,479 | $908 | $22,571 |
| 2024 | $5,056 | $15,974 | $648 | $15,326 |
| 2023 | $4,885 | $15,974 | $648 | $15,326 |
| 2022 | $4,885 | $15,974 | $648 | $15,326 |
| 2021 | $4,216 | $11,346 | $551 | $10,795 |
| 2020 | $4,160 | $11,346 | $551 | $10,795 |
| 2019 | $4,181 | $12,750 | $551 | $12,199 |
| 2018 | $3,033 | $8,483 | $486 | $7,997 |
| 2017 | $1,795 | $8,483 | $486 | $7,997 |
| 2016 | $1,964 | $8,483 | $486 | $7,997 |
| 2015 | $1,481 | $6,798 | $421 | $6,377 |
| 2014 | $1,481 | $6,798 | $421 | $6,377 |
| 2013 | $1,404 | $6,798 | $421 | $6,377 |
Source: Public Records
Map
Nearby Homes
- 355 Wilmington Dr Unit C1
- 370 Wilmington Dr Unit D2
- 615 Mallard Ct Unit C2
- 748 Sterling Ct Unit A2
- 745 Candleridge Ct Unit B2
- 195 Mary Ct Unit A
- 194 Robert Ct Unit A
- 119 E Railroad Ave
- 110 N Chase Ave
- 275 E Railroad Ave Unit 101
- 305 E Country Dr
- 27W607 Devon Ave
- 1011 Sandpiper Ct
- 1105 Sandpiper Ct
- 6835 Plumtree Ln
- 6881 Hickory St
- 6967 Hemlock St
- 6988 Plumtree Ln
- 128 Sycamore Ave
- 2110 Cherry Ave
- 657 Thorntree Ct Unit C2
- 657 Thorntree Ct Unit C1
- 657 Thorntree Ct Unit D1
- 657 Thorntree Ct Unit 27B22
- 311 Newport Ln Unit B1
- 311 Newport Ln Unit A1
- 311 Newport Ln Unit A2
- 311 Newport Ln Unit B2
- 303 Newport Ln Unit C2
- 303 Newport Ln Unit D2
- 303 Newport Ln Unit D1
- 303 Newport Ln Unit C1
- 303 Newport Ln Unit D2
- 668 Thorntree Ct Unit 24B21
- 668 Thorntree Ct Unit B1
- 668 Thorntree Ct Unit A1
- 668 Thorntree Ct Unit A2
- 668 Thorntree Ct Unit B2
- 674 Thorntree Ct Unit D1
- 674 Thorntree Ct Unit D2
Your Personal Tour Guide
Ask me questions while you tour the home.