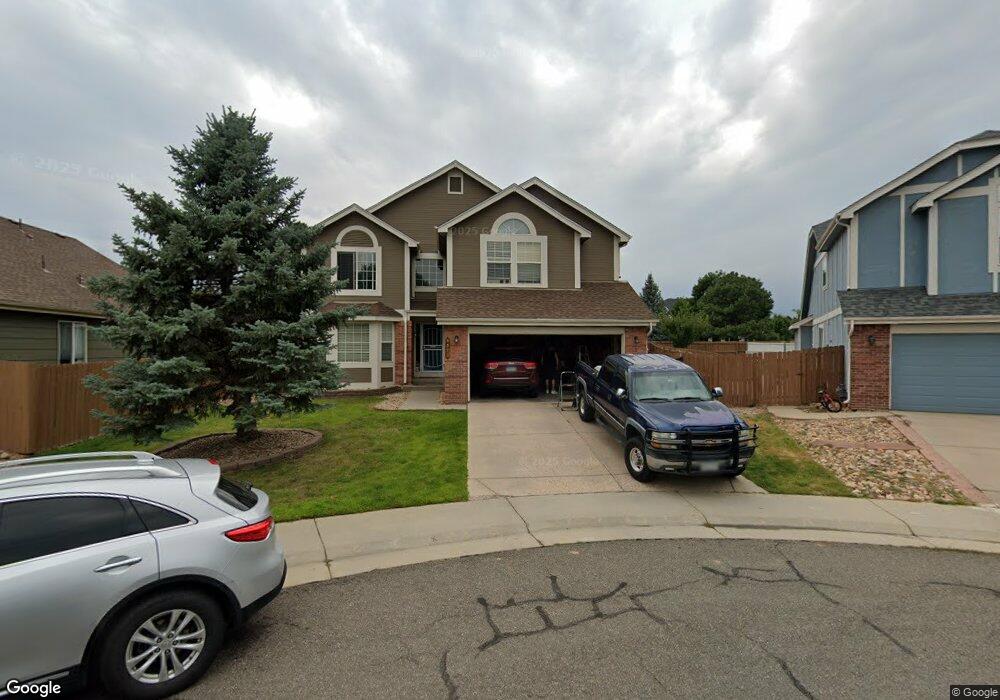
6571 Nile Cir Arvada, CO 80007
Meadows at Westwoods NeighborhoodEstimated Value: $816,000 - $862,000
5
Beds
3
Baths
2,888
Sq Ft
$292/Sq Ft
Est. Value
About This Home
This home is located at 6571 Nile Cir, Arvada, CO 80007 and is currently estimated at $843,113, approximately $291 per square foot. 6571 Nile Cir is a home located in Jefferson County with nearby schools including West Woods Elementary School, Drake Junior High School, and Ralston Valley Senior High School.
Ownership History
Date
Name
Owned For
Owner Type
Purchase Details
Closed on
Jan 17, 2019
Sold by
Amsm Llc
Bought by
Nealer Karl F
Current Estimated Value
Home Financials for this Owner
Home Financials are based on the most recent Mortgage that was taken out on this home.
Original Mortgage
$513,000
Outstanding Balance
$451,943
Interest Rate
4.7%
Mortgage Type
New Conventional
Estimated Equity
$391,170
Purchase Details
Closed on
Feb 11, 2016
Sold by
Merrin Arlen and Merrin Linda
Bought by
Amsm Llc
Purchase Details
Closed on
Dec 23, 2013
Sold by
Flores Baudelio
Bought by
Merrin Arlen and Merrin Linda
Home Financials for this Owner
Home Financials are based on the most recent Mortgage that was taken out on this home.
Original Mortgage
$243,750
Interest Rate
4.34%
Mortgage Type
New Conventional
Purchase Details
Closed on
Nov 7, 2001
Sold by
Flores Baudelio and Herrera Gloria R
Bought by
Flores Baudelio
Purchase Details
Closed on
Feb 11, 1997
Sold by
U S Home Corp
Bought by
Flores Baudelio and Herrera Gloria R
Create a Home Valuation Report for This Property
The Home Valuation Report is an in-depth analysis detailing your home's value as well as a comparison with similar homes in the area
Home Values in the Area
Average Home Value in this Area
Purchase History
| Date | Buyer | Sale Price | Title Company |
|---|---|---|---|
| Nealer Karl F | $540,000 | Land Title Company | |
| Amsm Llc | -- | None Available | |
| Merrin Arlen | $325,000 | Guardian Title | |
| Flores Baudelio | -- | -- | |
| Flores Baudelio | $196,840 | -- |
Source: Public Records
Mortgage History
| Date | Status | Borrower | Loan Amount |
|---|---|---|---|
| Open | Nealer Karl F | $513,000 | |
| Previous Owner | Merrin Arlen | $243,750 |
Source: Public Records
Tax History
| Year | Tax Paid | Tax Assessment Tax Assessment Total Assessment is a certain percentage of the fair market value that is determined by local assessors to be the total taxable value of land and additions on the property. | Land | Improvement |
|---|---|---|---|---|
| 2024 | $4,805 | $49,537 | $7,507 | $42,030 |
| 2023 | $4,805 | $49,537 | $7,507 | $42,030 |
| 2022 | $3,890 | $39,718 | $8,087 | $31,631 |
| 2021 | $3,954 | $40,861 | $8,320 | $32,541 |
| 2020 | $3,031 | $31,405 | $9,697 | $21,708 |
| 2019 | $2,990 | $31,405 | $9,697 | $21,708 |
| 2018 | $2,776 | $28,346 | $8,808 | $19,538 |
| 2017 | $2,541 | $28,346 | $8,808 | $19,538 |
| 2016 | $2,833 | $29,768 | $8,714 | $21,054 |
| 2015 | $2,632 | $29,768 | $8,714 | $21,054 |
| 2014 | $2,632 | $25,991 | $6,990 | $19,001 |
Source: Public Records
Map
Nearby Homes
- 16069 W 65th Place
- 16092 W 66th Cir
- 16040 W 64th Way
- 15902 W 64th Ave
- 15670 W 64th Place
- 15812 W 64th Ave
- 6761 Westwoods Cir
- 15516 W 64th Loop Unit F
- 6284 Orion Ct Unit B
- 6512 Quartz Cir
- 16335 W 62nd Ln Unit B
- 16475 W 63rd Place
- 15878 W 62nd Place
- 15345 W 64th Ln Unit 107
- 15345 W 64th Ln Unit 103
- 15233 W 65th Ave Unit C
- 15296 W 66th Dr Unit G
- 15295 W 64th Ln Unit 207
- 6951 Nile Ct
- 6350 Rogers St
- 6561 Nile Cir
- 6581 Nile Cir
- 6590 Nile Cir
- 6556 Nile Cir
- 6580 Nile Cir
- 6560 Nile Cir
- 16019 W 65th Place
- 6570 Nile Cir
- 15968 W 65th Place
- 16029 W 65th Place
- 15988 W 65th Place
- 16039 W 65th Place
- 6552 Nile Cir
- 15980 W 66th Place
- 15960 W 66th Place
- 6557 Nile Cir
- 15889 W 65th Place
- 15940 W 66th Place
- 6530 Orchard Ct
- 16049 W 65th Place
Your Personal Tour Guide
Ask me questions while you tour the home.