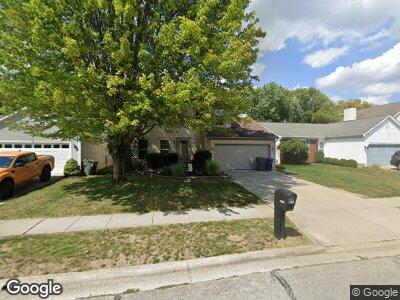
6572 Winbarr Way Canal Winchester, OH 43110
East Columbus-White Ash NeighborhoodEstimated Value: $294,818 - $310,000
3
Beds
3
Baths
1,576
Sq Ft
$191/Sq Ft
Est. Value
About This Home
This home is located at 6572 Winbarr Way, Canal Winchester, OH 43110 and is currently estimated at $301,455, approximately $191 per square foot. 6572 Winbarr Way is a home located in Franklin County with nearby schools including Winchester Trail Elementary School, Indian Trail Elementary School, and Canal Winchester Middle School.
Ownership History
Date
Name
Owned For
Owner Type
Purchase Details
Closed on
Jun 12, 2017
Sold by
Dunson Amy L and Davidson Amy L
Bought by
Springer Billy
Current Estimated Value
Home Financials for this Owner
Home Financials are based on the most recent Mortgage that was taken out on this home.
Original Mortgage
$151,650
Outstanding Balance
$127,741
Interest Rate
4.05%
Mortgage Type
New Conventional
Estimated Equity
$173,714
Purchase Details
Closed on
Dec 4, 2003
Sold by
Hutchinson Harry D and Hutchinson Tina M
Bought by
Dunson Amy L
Home Financials for this Owner
Home Financials are based on the most recent Mortgage that was taken out on this home.
Original Mortgage
$109,200
Interest Rate
6.03%
Mortgage Type
Unknown
Purchase Details
Closed on
Dec 22, 1994
Sold by
Borror Corp
Bought by
Hutchinson Harry D and Hutchinson Tina N
Home Financials for this Owner
Home Financials are based on the most recent Mortgage that was taken out on this home.
Original Mortgage
$116,375
Interest Rate
9.19%
Mortgage Type
New Conventional
Create a Home Valuation Report for This Property
The Home Valuation Report is an in-depth analysis detailing your home's value as well as a comparison with similar homes in the area
Home Values in the Area
Average Home Value in this Area
Purchase History
| Date | Buyer | Sale Price | Title Company |
|---|---|---|---|
| Springer Billy | $168,500 | Northwest Title | |
| Dunson Amy L | $136,500 | Columbus Title Agency Inc | |
| Hutchinson Harry D | $122,500 | -- |
Source: Public Records
Mortgage History
| Date | Status | Borrower | Loan Amount |
|---|---|---|---|
| Open | Springer Billy | $151,650 | |
| Previous Owner | Dunson Amy L | $38,357 | |
| Previous Owner | Dunson Amy L | $109,200 | |
| Previous Owner | Dunson Amy L | $20,475 | |
| Previous Owner | Hutchinson Harry D | $112,400 | |
| Previous Owner | Hutchinson Harry D | $116,375 |
Source: Public Records
Tax History Compared to Growth
Tax History
| Year | Tax Paid | Tax Assessment Tax Assessment Total Assessment is a certain percentage of the fair market value that is determined by local assessors to be the total taxable value of land and additions on the property. | Land | Improvement |
|---|---|---|---|---|
| 2024 | $4,342 | $89,920 | $23,280 | $66,640 |
| 2023 | $4,316 | $89,915 | $23,275 | $66,640 |
| 2022 | $3,178 | $58,310 | $13,230 | $45,080 |
| 2021 | $3,214 | $58,310 | $13,230 | $45,080 |
| 2020 | $3,202 | $58,310 | $13,230 | $45,080 |
| 2019 | $2,971 | $46,420 | $10,610 | $35,810 |
| 2018 | $2,935 | $46,420 | $10,610 | $35,810 |
| 2017 | $2,934 | $46,420 | $10,610 | $35,810 |
| 2016 | $2,963 | $44,210 | $8,610 | $35,600 |
| 2015 | $2,973 | $44,210 | $8,610 | $35,600 |
| 2014 | $2,972 | $44,210 | $8,610 | $35,600 |
| 2013 | $1,552 | $46,550 | $9,065 | $37,485 |
Source: Public Records
Map
Nearby Homes
- 6786 Warriner Way
- 5694 Danmar Dr
- 6802 Kristins Cove Ln
- 5682 Levi Kramer Blvd
- 6963 Weurful Dr
- 5443 John Browning Ct
- 5680 Winchester Pike
- 6999 Winchester Crossing Blvd
- 6682 Lagrange Dr Unit 48B
- 5176 Lodi Dr Unit 26B
- 6983 Remsen Dr Unit 77A
- 5210 Novelty Ave Unit 73D
- 7011 Selva Trail Dr
- 6709 Axtel Dr Unit 5A
- 6730 Axtel Dr
- 6706 Axtel Dr Unit 7A
- 5536 Winchester Meadows Dr
- 5569 Harvest Curve Ln
- 5846 Canal Bridge Dr
- 5132 Eastbend Dr
- 6572 Winbarr Way
- 6578 Winbarr Way
- 6566 Winbarr Way
- 6584 Winbarr Way
- 6560 Winbarr Way
- 6592 Winbarr Way
- 6554 Winbarr Way
- 6569 Winbarr Way
- 6575 Winbarr Way
- 6581 Winbarr Way
- 6600 Winbarr Way
- 6551 Winbarr Way
- 6548 Winbarr Way
- 6587 Winbarr Way
- 6553 Winbarr Way
- 6608 Winbarr Way
- 6593 Winbarr Way
- 6545 Winbarr Way
- 6542 Winbarr Way
- 6599 Winbarr Way