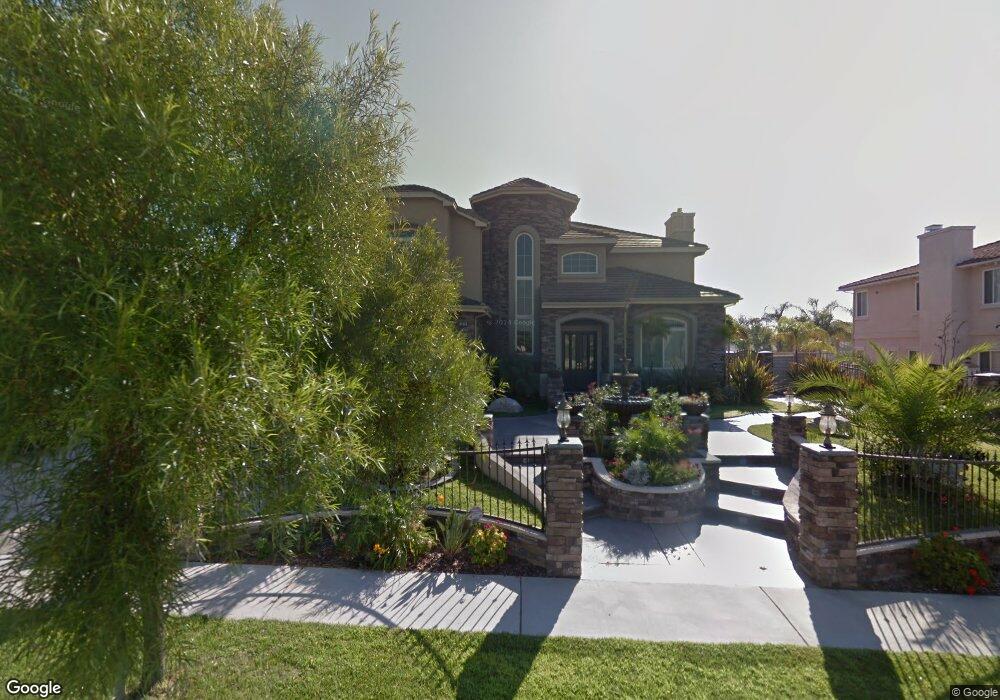
6575 Di Carlo Place Rancho Cucamonga, CA 91739
Etiwanda NeighborhoodEstimated Value: $1,636,151 - $1,983,000
5
Beds
5
Baths
4,804
Sq Ft
$372/Sq Ft
Est. Value
About This Home
This home is located at 6575 Di Carlo Place, Rancho Cucamonga, CA 91739 and is currently estimated at $1,787,050, approximately $371 per square foot. 6575 Di Carlo Place is a home located in San Bernardino County with nearby schools including Grapeland Elementary, Etiwanda Intermediate, and Etiwanda High.
Ownership History
Date
Name
Owned For
Owner Type
Purchase Details
Closed on
Jan 5, 2009
Sold by
Hernandez Rogelio
Bought by
Hernandez Rogelio and Arbaiza Cecilia E
Current Estimated Value
Purchase Details
Closed on
Nov 24, 2008
Sold by
Gmac Mortgage Llc
Bought by
Hernandez Rogelio and Hernandez Margarita
Purchase Details
Closed on
Sep 22, 2008
Sold by
Bortolamedi Sergio E
Bought by
Gmac Mortgage Llc and Gmac Mortgage Corp
Purchase Details
Closed on
Sep 23, 2004
Sold by
Toll Ca Iv Lp
Bought by
Bortolamedi Sergio E and Bortolamedi Heather D
Home Financials for this Owner
Home Financials are based on the most recent Mortgage that was taken out on this home.
Original Mortgage
$747,200
Interest Rate
5.74%
Mortgage Type
Stand Alone First
Create a Home Valuation Report for This Property
The Home Valuation Report is an in-depth analysis detailing your home's value as well as a comparison with similar homes in the area
Home Values in the Area
Average Home Value in this Area
Purchase History
| Date | Buyer | Sale Price | Title Company |
|---|---|---|---|
| Hernandez Rogelio | -- | None Available | |
| Hernandez Rogelio | $775,000 | First American Title Ins Co | |
| Gmac Mortgage Llc | $753,300 | None Available | |
| Bortolamedi Sergio E | $934,500 | First American |
Source: Public Records
Mortgage History
| Date | Status | Borrower | Loan Amount |
|---|---|---|---|
| Previous Owner | Bortolamedi Sergio E | $747,200 |
Source: Public Records
Tax History Compared to Growth
Tax History
| Year | Tax Paid | Tax Assessment Tax Assessment Total Assessment is a certain percentage of the fair market value that is determined by local assessors to be the total taxable value of land and additions on the property. | Land | Improvement |
|---|---|---|---|---|
| 2025 | $11,370 | $1,035,702 | $243,387 | $792,315 |
| 2024 | $11,370 | $1,015,394 | $238,615 | $776,779 |
| 2023 | $11,104 | $995,484 | $233,936 | $761,548 |
| 2022 | $10,982 | $975,965 | $229,349 | $746,616 |
| 2021 | $10,801 | $956,828 | $224,852 | $731,976 |
| 2020 | $10,786 | $947,016 | $222,546 | $724,470 |
| 2019 | $10,373 | $928,447 | $218,182 | $710,265 |
| 2018 | $10,276 | $910,242 | $213,904 | $696,338 |
| 2017 | $9,714 | $892,394 | $209,710 | $682,684 |
| 2016 | $9,382 | $874,896 | $205,598 | $669,298 |
| 2015 | $9,318 | $861,755 | $202,510 | $659,245 |
| 2014 | $9,047 | $844,874 | $198,543 | $646,331 |
Source: Public Records
Map
Nearby Homes
- 13060 Carnesi Dr
- 13031 Vista St
- 6575 Etiwanda Ave
- 13042 Larrera St
- 6525 Etiwanda Ave
- 13548 Smokestone St
- 6264 Shore Pine Ct
- 13408 Silver Sky Rd
- 6822 Foxtail Ct
- 13428 Silver Sky Rd
- 13564 Williamson Rd
- 6602 Torrey Pine Ct
- 13751 Smokestone St
- 13667 Victoria St
- 6732 Plum Way
- 7161 East Ave Unit 4
- 12794 Windstar Dr
- 7334 Nightfall
- 6318 Echo Mountain
- 6502 Dogwood Place
- 6559 Di Carlo Place
- 6591 Di Carlo Place
- 6582 Ash Ave
- 6562 Ash Ave
- 6594 Ash Ave
- 6605 Di Carlo Place
- 6545 Di Carlo Place
- 13162 Mungo Ct
- 6612 Ash Ave
- 6624 Ash Ave
- 6529 Di Carlo Place
- 6617 Di Carlo Place
- 13146 Mungo Ct
- 6575 Ash Ave
- 6583 Ash Ave
- 6595 Ash Ave
- 13145 Norcia Dr
- 6632 Ash Ave
- 6613 Ash Ave
- 6618 Di Carlo Place