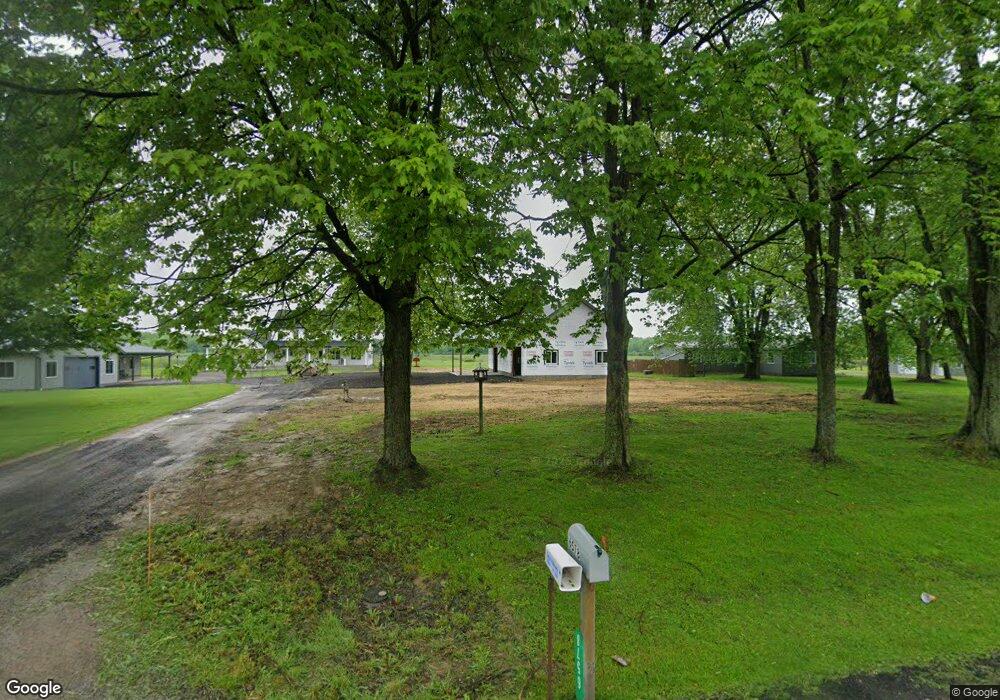
6578 State Route 534 West Farmington, OH 44491
Estimated Value: $291,000 - $352,000
7
Beds
2
Baths
3,104
Sq Ft
$105/Sq Ft
Est. Value
About This Home
This home is located at 6578 State Route 534, West Farmington, OH 44491 and is currently estimated at $325,315, approximately $104 per square foot. 6578 State Route 534 is a home located in Trumbull County with nearby schools including Bristol Elementary School and Bristol High School.
Ownership History
Date
Name
Owned For
Owner Type
Purchase Details
Closed on
Aug 10, 2001
Sold by
Wengerd Raymond A and Wengerd Marilyn
Bought by
Miller Daniel D K and Miller Iva E
Current Estimated Value
Home Financials for this Owner
Home Financials are based on the most recent Mortgage that was taken out on this home.
Original Mortgage
$65,689
Interest Rate
7.15%
Mortgage Type
New Conventional
Purchase Details
Closed on
Sep 21, 1999
Sold by
Miller Daniel D K and Miller Iva E
Bought by
Byler Nathaniel U and Byler Ruth D
Home Financials for this Owner
Home Financials are based on the most recent Mortgage that was taken out on this home.
Original Mortgage
$40,000
Interest Rate
8.21%
Purchase Details
Closed on
Apr 24, 1998
Sold by
Gingerich Daniel R and Gingerich Emma D
Bought by
Miller Daniel D K and Miller Ive E
Home Financials for this Owner
Home Financials are based on the most recent Mortgage that was taken out on this home.
Original Mortgage
$50,972
Interest Rate
7.26%
Create a Home Valuation Report for This Property
The Home Valuation Report is an in-depth analysis detailing your home's value as well as a comparison with similar homes in the area
Home Values in the Area
Average Home Value in this Area
Purchase History
| Date | Buyer | Sale Price | Title Company |
|---|---|---|---|
| Miller Daniel D K | $65,000 | -- | |
| Byler Nathaniel U | $75,000 | -- | |
| Miller Daniel D K | $47,000 | -- |
Source: Public Records
Mortgage History
| Date | Status | Borrower | Loan Amount |
|---|---|---|---|
| Open | Miller Daniel D K | $115,467 | |
| Previous Owner | Miller Daniel D K | $65,689 | |
| Previous Owner | Byler Nathaniel U | $40,000 | |
| Previous Owner | Miller Daniel D K | $50,972 |
Source: Public Records
Tax History Compared to Growth
Tax History
| Year | Tax Paid | Tax Assessment Tax Assessment Total Assessment is a certain percentage of the fair market value that is determined by local assessors to be the total taxable value of land and additions on the property. | Land | Improvement |
|---|---|---|---|---|
| 2024 | $5,076 | $115,920 | $11,060 | $104,860 |
| 2023 | $5,076 | $72,630 | $11,060 | $61,570 |
| 2022 | $2,780 | $56,770 | $10,220 | $46,550 |
| 2021 | $2,785 | $56,770 | $10,220 | $46,550 |
| 2020 | $2,651 | $56,770 | $10,220 | $46,550 |
| 2019 | $1,971 | $38,150 | $9,450 | $28,700 |
| 2018 | $1,966 | $38,150 | $9,450 | $28,700 |
| 2017 | $1,956 | $38,150 | $9,450 | $28,700 |
| 2016 | $2,127 | $41,130 | $8,120 | $33,010 |
| 2015 | $1,998 | $41,130 | $8,120 | $33,010 |
| 2014 | $1,992 | $41,130 | $8,120 | $33,010 |
| 2013 | $2,034 | $41,130 | $8,120 | $33,010 |
Source: Public Records
Map
Nearby Homes
- 229 2nd St
- 7126 State Route 534
- 5801 Girdle Rd
- 3827 Housel Craft Rd
- 4404 N Lake Rd
- VL 2 N Lake Rd
- VL 1 N Lake Rd
- 16510 Bundysburg Rd
- 0 Lakeview Rd Unit 5014374
- 6102 Corey Hunt Rd
- VL West Rd
- 4810 Hickory Rd
- V/L Lake St
- 8070 Parkman Mesopotamia Rd
- 16995 Bundysburg Rd
- 17050 Nash Rd
- 16990 Nash Rd
- 16765 Old State Rd
- 7434 Fenton Rd NW
- 2271 Peck Leach Rd
- 6566 State Route 534
- 6559 State Route 534
- 6554 State Route 534
- 4589 State 88
- 6589 State Route 534
- 6618 State Route 534
- 6611 State Route 534
- 6739 State Route 534
- 6429 State Route 534
- 6749 State Route 534
- 6401 State Route 534
- 6746 State Route 534
- 6393 State Route 534
- 6393 State Route 534
- 4389 Larson West Rd
- 7710 Brigden Rd
- 7700 Brigden Rd
- 4387 Larson West Rd
- 6372 State Route 534
- 6372 State Route 534