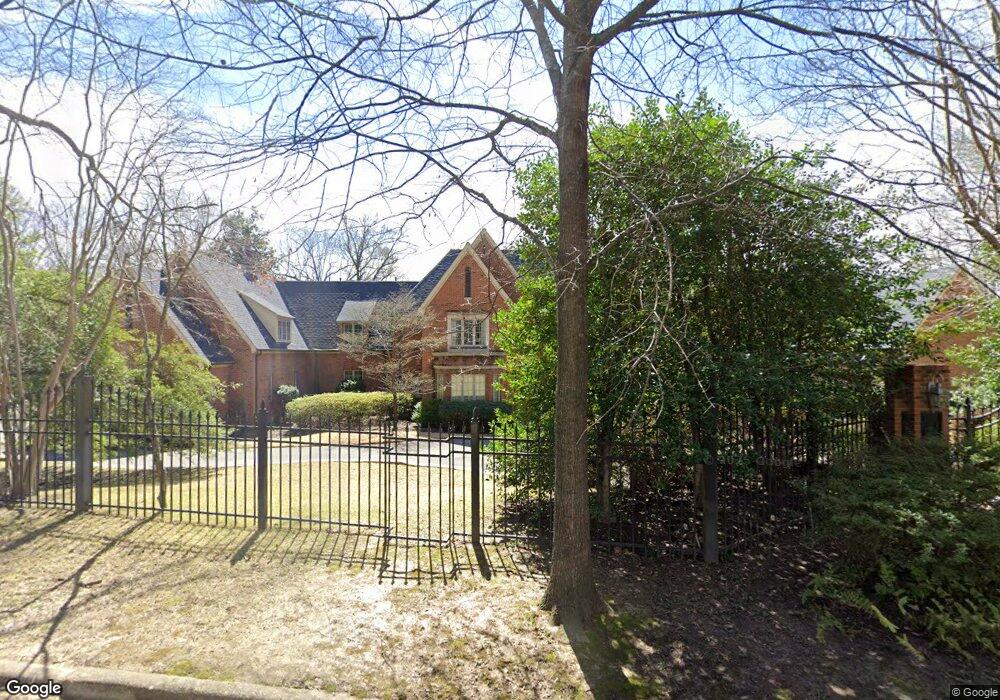
6579 Kirby Forest Cove Memphis, TN 38119
Poplar Pines NeighborhoodEstimated Value: $1,785,000 - $2,313,874
5
Beds
8
Baths
10,408
Sq Ft
$207/Sq Ft
Est. Value
About This Home
This home is located at 6579 Kirby Forest Cove, Memphis, TN 38119 and is currently estimated at $2,151,969, approximately $206 per square foot. 6579 Kirby Forest Cove is a home located in Shelby County with nearby schools including Balmoral Ridgeway Elementary School, Ridgeway Middle School, and Ridgeway High School.
Ownership History
Date
Name
Owned For
Owner Type
Purchase Details
Closed on
Jul 22, 2024
Sold by
Dunavant John Dobson and Dunavant Jennifer Pierotti
Bought by
Russ Claude Fair and Russ Meredith
Current Estimated Value
Home Financials for this Owner
Home Financials are based on the most recent Mortgage that was taken out on this home.
Original Mortgage
$766,000
Outstanding Balance
$728,296
Interest Rate
6.13%
Mortgage Type
New Conventional
Estimated Equity
$1,423,673
Purchase Details
Closed on
Jan 8, 2014
Sold by
Dunavant John Dobson
Bought by
Dunvant John Dobson and Dunvant Jennifer Pierotti
Purchase Details
Closed on
Oct 15, 2013
Sold by
Dunavant Leslie Grayson
Bought by
Dunavant John Dobson
Purchase Details
Closed on
Jun 24, 1998
Sold by
Saino Joseph N and Saino Felix H
Bought by
Dunavant John D and Dunavant Leslie G
Home Financials for this Owner
Home Financials are based on the most recent Mortgage that was taken out on this home.
Original Mortgage
$1,100,000
Interest Rate
7.1%
Create a Home Valuation Report for This Property
The Home Valuation Report is an in-depth analysis detailing your home's value as well as a comparison with similar homes in the area
Home Values in the Area
Average Home Value in this Area
Purchase History
| Date | Buyer | Sale Price | Title Company |
|---|---|---|---|
| Russ Claude Fair | $2,400,000 | None Listed On Document | |
| Dunvant John Dobson | -- | None Available | |
| Dunavant John Dobson | -- | None Available | |
| Dunavant John D | $800,000 | -- |
Source: Public Records
Mortgage History
| Date | Status | Borrower | Loan Amount |
|---|---|---|---|
| Open | Russ Claude Fair | $766,000 | |
| Previous Owner | Dunavant John D | $1,100,000 |
Source: Public Records
Tax History Compared to Growth
Tax History
| Year | Tax Paid | Tax Assessment Tax Assessment Total Assessment is a certain percentage of the fair market value that is determined by local assessors to be the total taxable value of land and additions on the property. | Land | Improvement |
|---|---|---|---|---|
| 2025 | $13,560 | $571,700 | $102,700 | $469,000 |
| 2024 | $13,560 | $400,000 | $41,975 | $358,025 |
| 2023 | $24,367 | $400,000 | $41,975 | $358,025 |
| 2022 | $24,367 | $400,000 | $41,975 | $358,025 |
| 2021 | $40,034 | $649,575 | $41,975 | $607,600 |
| 2020 | $20,781 | $286,800 | $41,975 | $244,825 |
| 2019 | $20,781 | $286,800 | $41,975 | $244,825 |
| 2018 | $20,782 | $286,800 | $41,975 | $244,825 |
| 2017 | $11,787 | $286,800 | $41,975 | $244,825 |
| 2016 | $12,564 | $287,500 | $0 | $0 |
| 2014 | $12,564 | $287,500 | $0 | $0 |
Source: Public Records
Map
Nearby Homes
- 2305 Hickory Forest Dr
- 6617 Pidgeon Woods Cove
- 6645 Green Shadows Ln
- 2362 Corinne Oak Ct
- 2315 Kirby Pkwy
- 6542 Green Shadows Ln
- 2264 Forest Grove Cove
- 6551 Espalier Cir
- 2266 Wickerwood Cove
- 5488 E East End Village Dr E
- 5482 E Dr E
- 6768 Tangleberry Ln
- 2357 Thornwood Ln
- 6691 Vinings Creek Cove W
- 2342 Massey Rd
- 6536 Sulgrave Dr
- 6764 Sunburst Cove
- 6771 Sunburst Cove
- 6520 Robbins Ridge Ln
- 6246 Quince Rd
- 6603 Kirby Forest Cove
- 6590 Kirby Forest Cove
- 6602 Pidgeon Woods Cove
- 6580 Kirby Forest Cove
- 6576 Pidgeon Hall
- 6557 Kirby Forest Cove
- 6614 Kirby Forest Cove
- 6594 Pidgeon Woods Cove
- 6566 Pidgeon Hall
- 6560 Kirby Forest Cove
- 6604 Kirby Forest Cove
- 6610 Pidgeon Woods Cove
- 6554 Pidgeon Hall
- 6543 Kirby Forest Cove
- 2329 Hickory Forest Dr
- 6544 Kirby Forest Cove
- 6620 Pidgeon Woods Cove
- 6584 Pidgeon Hall
- 2319 Hickory Forest Dr
- 6577 Pidgeon Hall