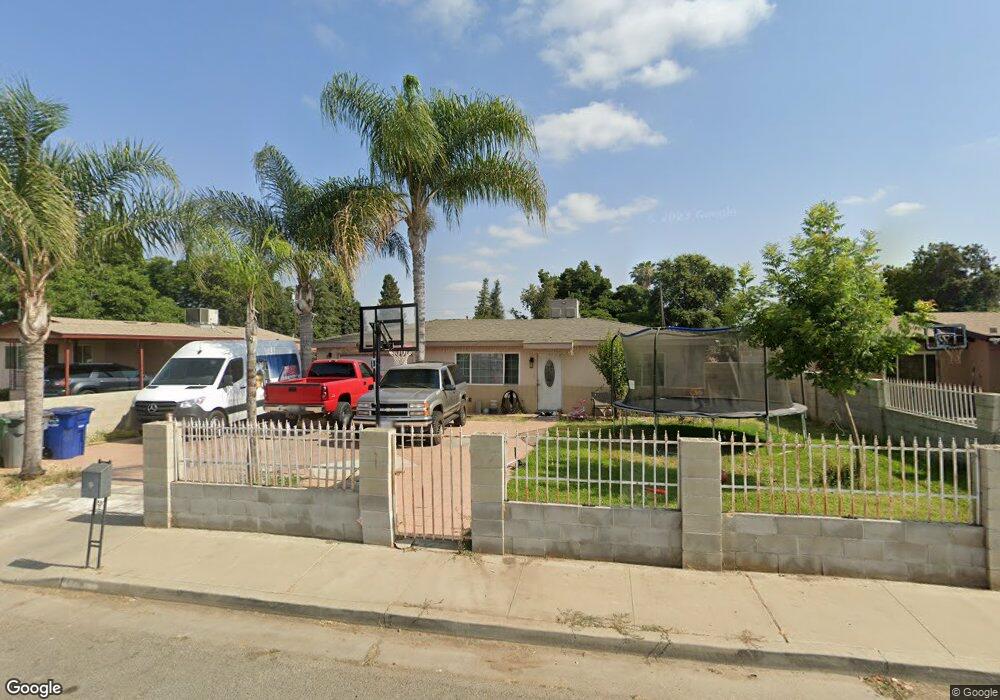
658 E Larry St Farmersville, CA 93223
Estimated Value: $267,036 - $342,000
--
Bed
2
Baths
1,948
Sq Ft
$159/Sq Ft
Est. Value
About This Home
This home is located at 658 E Larry St, Farmersville, CA 93223 and is currently estimated at $309,509, approximately $158 per square foot. 658 E Larry St is a home located in Tulare County with nearby schools including J.E. Hester Elementary School, George L. Snowden Elementary School, and Freedom Elementary School.
Ownership History
Date
Name
Owned For
Owner Type
Purchase Details
Closed on
Feb 18, 2003
Sold by
Cervantes Maria and Nanez Rogelia
Bought by
Cervantes Maria
Current Estimated Value
Home Financials for this Owner
Home Financials are based on the most recent Mortgage that was taken out on this home.
Original Mortgage
$53,000
Interest Rate
5.78%
Purchase Details
Closed on
Nov 6, 1997
Sold by
Hud
Bought by
Cervantes Maria and Nanez Rogalia
Home Financials for this Owner
Home Financials are based on the most recent Mortgage that was taken out on this home.
Original Mortgage
$53,200
Interest Rate
7.3%
Purchase Details
Closed on
Mar 19, 1997
Sold by
Lucatero Ignacio and Alvarez Trinidad Maria
Bought by
Countrywide Home Loans Inc and Countrywide Funding Corp
Purchase Details
Closed on
Feb 19, 1997
Sold by
Countrywide Home Loans Inc
Bought by
Hud
Purchase Details
Closed on
Jul 26, 1996
Sold by
Lucatera Ignacio and Alvarez Trinidad M
Bought by
American Surety Company
Create a Home Valuation Report for This Property
The Home Valuation Report is an in-depth analysis detailing your home's value as well as a comparison with similar homes in the area
Home Values in the Area
Average Home Value in this Area
Purchase History
| Date | Buyer | Sale Price | Title Company |
|---|---|---|---|
| Cervantes Maria | -- | Chicago Title Co | |
| Cervantes Maria | $56,000 | North American Title Co | |
| Countrywide Home Loans Inc | $72,093 | -- | |
| Hud | -- | -- | |
| American Surety Company | $32,844 | First American Title Ins Co |
Source: Public Records
Mortgage History
| Date | Status | Borrower | Loan Amount |
|---|---|---|---|
| Closed | Cervantes Maria | $53,000 | |
| Closed | Cervantes Maria | $53,200 |
Source: Public Records
Tax History Compared to Growth
Tax History
| Year | Tax Paid | Tax Assessment Tax Assessment Total Assessment is a certain percentage of the fair market value that is determined by local assessors to be the total taxable value of land and additions on the property. | Land | Improvement |
|---|---|---|---|---|
| 2025 | $1,117 | $108,438 | $32,474 | $75,964 |
| 2024 | $1,117 | $106,313 | $31,838 | $74,475 |
| 2023 | $1,118 | $104,229 | $31,214 | $73,015 |
| 2022 | $1,034 | $102,186 | $30,602 | $71,584 |
| 2021 | $1,013 | $100,182 | $30,002 | $70,180 |
| 2020 | $1,000 | $99,154 | $29,694 | $69,460 |
| 2019 | $1,012 | $97,210 | $29,112 | $68,098 |
| 2018 | $980 | $95,304 | $28,541 | $66,763 |
| 2017 | $992 | $93,435 | $27,981 | $65,454 |
| 2016 | $933 | $91,603 | $27,432 | $64,171 |
| 2015 | $889 | $90,227 | $27,020 | $63,207 |
| 2014 | $889 | $88,460 | $26,491 | $61,969 |
Source: Public Records
Map
Nearby Homes
- 680 E Larry St
- 738 E Larry St
- 885 E Ash St
- 903 E Ash St
- 438 N Magnolia Ave
- 209 S Magnolia Ave
- 732 N Dwight Ave
- 528 S Camelia Ave
- 327 S Farmersville Blvd
- 701 Farmersville Rd
- 753 N Brundage Ave
- 896 Farmersville Rd
- 0 S Farmersville Blvd Unit 238390
- 245 W Oakland St
- 322 E Citrus Dr
- 0 Avenue 288
- 896 N Mariposa Ave
- 1643 Tehama Ave
- 0 Avenue 288
- 391 Teddy St
- 664 E Larry St
- 604 E Larry St
- 582 E Larry St
- 613 E Costner St
- 639 E Larry St
- 631 E Costner St
- 665 E Larry St
- 718 E Larry St
- 577 E Costner St
- 370 S Rose Ave
- 681 E Larry St
- 667 E Costner St
- 559 E Costner St
- 577 E Larry St
- 595 E Costner St
- 280 N Hester Ave
- 568 E Larry St
- 549 E Larry St
- 715 E Larry St
- 768 E Larry St