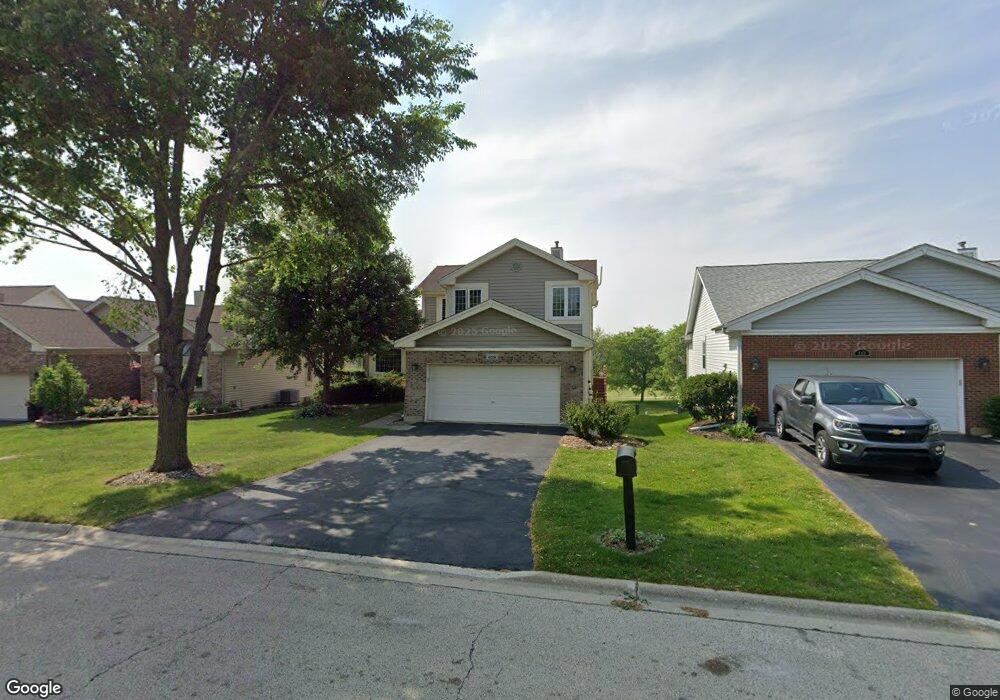
658 Golfers Ln Bartlett, IL 60103
Estimated Value: $416,276 - $485,000
3
Beds
3
Baths
2,480
Sq Ft
$179/Sq Ft
Est. Value
About This Home
This home is located at 658 Golfers Ln, Bartlett, IL 60103 and is currently estimated at $444,569, approximately $179 per square foot. 658 Golfers Ln is a home located in Cook County with nearby schools including Liberty Elementary School, Kenyon Woods Middle School, and South Elgin High School.
Ownership History
Date
Name
Owned For
Owner Type
Purchase Details
Closed on
Feb 7, 2009
Sold by
Amargos Gerardo B and Amargos Evelyn
Bought by
Amargos Gerardo B and Amargos Evelyn M
Current Estimated Value
Purchase Details
Closed on
Jan 30, 1998
Sold by
Fong Mui Wing Hang and Fong Mui Nim
Bought by
Amargos Gerardo B and Amargos Evelyn
Home Financials for this Owner
Home Financials are based on the most recent Mortgage that was taken out on this home.
Original Mortgage
$150,000
Outstanding Balance
$23,488
Interest Rate
7.16%
Estimated Equity
$421,081
Purchase Details
Closed on
Jun 28, 1996
Sold by
Mui Nim Fong and Mui Wing Hang
Bought by
Fong Mui Wing Hang and Fong Mui Nim
Home Financials for this Owner
Home Financials are based on the most recent Mortgage that was taken out on this home.
Original Mortgage
$458,000
Interest Rate
6%
Create a Home Valuation Report for This Property
The Home Valuation Report is an in-depth analysis detailing your home's value as well as a comparison with similar homes in the area
Home Values in the Area
Average Home Value in this Area
Purchase History
| Date | Buyer | Sale Price | Title Company |
|---|---|---|---|
| Amargos Gerardo B | -- | None Available | |
| Amargos Gerardo B | $238,500 | Lawyers Title Insurance Corp | |
| Fong Mui Wing Hang | -- | Ticor Title Insurance |
Source: Public Records
Mortgage History
| Date | Status | Borrower | Loan Amount |
|---|---|---|---|
| Open | Amargos Gerardo B | $150,000 | |
| Previous Owner | Fong Mui Wing Hang | $458,000 |
Source: Public Records
Tax History
| Year | Tax Paid | Tax Assessment Tax Assessment Total Assessment is a certain percentage of the fair market value that is determined by local assessors to be the total taxable value of land and additions on the property. | Land | Improvement |
|---|---|---|---|---|
| 2025 | $767 | $4,258 | $646 | $3,612 |
| 2024 | $767 | $3,021 | $549 | $2,472 |
| 2023 | $735 | $3,021 | $549 | $2,472 |
| 2022 | $735 | $3,021 | $549 | $2,472 |
| 2021 | $742 | $2,331 | $484 | $1,847 |
| 2020 | $741 | $2,331 | $484 | $1,847 |
| 2019 | $737 | $2,592 | $484 | $2,108 |
| 2018 | $902 | $2,868 | $419 | $2,449 |
| 2017 | $889 | $2,868 | $419 | $2,449 |
| 2016 | $859 | $2,868 | $419 | $2,449 |
| 2015 | $860 | $2,688 | $371 | $2,317 |
| 2014 | $851 | $2,688 | $371 | $2,317 |
| 2013 | $817 | $2,688 | $371 | $2,317 |
Source: Public Records
Map
Nearby Homes
- 610 Golfers Ln
- 1810 Golf View Dr
- 720 Thornbury Rd Unit 1115
- 1627 Spaulding Rd Unit 524
- 521 Ivory Ln
- 1265 Tamarack Dr Unit 72
- 1316 Foxglove Dr
- 1314 Foxglove Dr
- 1563 Yellowstone Dr
- 1261 Foxglove Dr
- 1374 Foxglove Dr
- 1328 Foxglove Dr
- 1326 Foxglove Dr
- 1376 Foxglove Dr
- 1324 Foxglove Dr
- 1372 Foxglove Dr
- 1368 Foxglove Dr
- 1285 Foxglove Dr
- 1283 Foxglove Dr
- 1330 Foxglove Dr
Your Personal Tour Guide
Ask me questions while you tour the home.