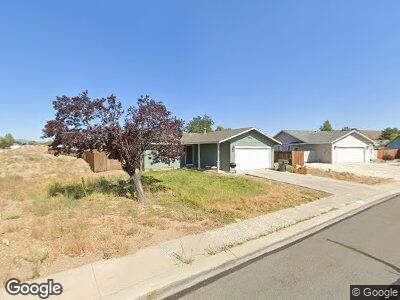
658 Leonard Ct Gardnerville, NV 89460
Estimated Value: $407,302 - $492,000
--
Bed
--
Bath
1,288
Sq Ft
$361/Sq Ft
Est. Value
About This Home
This home is located at 658 Leonard Ct, Gardnerville, NV 89460 and is currently estimated at $464,326, approximately $360 per square foot. 658 Leonard Ct is a home located in Douglas County with nearby schools including Gene Scarselli Elementary School, Pau Wa Lu Middle School, and Douglas County High School.
Create a Home Valuation Report for This Property
The Home Valuation Report is an in-depth analysis detailing your home's value as well as a comparison with similar homes in the area
Home Values in the Area
Average Home Value in this Area
Mortgage History
| Date | Status | Borrower | Loan Amount |
|---|---|---|---|
| Closed | Rich Paul | $89,941 | |
| Closed | Rich Paul | $50,000 | |
| Closed | Rich Paul F | $30,000 |
Source: Public Records
Tax History Compared to Growth
Tax History
| Year | Tax Paid | Tax Assessment Tax Assessment Total Assessment is a certain percentage of the fair market value that is determined by local assessors to be the total taxable value of land and additions on the property. | Land | Improvement |
|---|---|---|---|---|
| 2025 | $1,411 | $61,371 | $28,000 | $33,371 |
| 2024 | $1,370 | $61,962 | $28,000 | $33,962 |
| 2023 | $1,370 | $60,366 | $28,000 | $32,366 |
| 2022 | $1,330 | $53,911 | $23,100 | $30,811 |
| 2021 | $1,291 | $50,538 | $21,000 | $29,538 |
| 2020 | $1,254 | $50,377 | $21,000 | $29,377 |
| 2019 | $1,217 | $48,357 | $19,250 | $29,107 |
| 2018 | $1,182 | $43,996 | $15,750 | $28,246 |
| 2017 | $1,147 | $44,488 | $15,750 | $28,738 |
| 2016 | $1,118 | $41,457 | $12,250 | $29,207 |
| 2015 | $1,116 | $41,457 | $12,250 | $29,207 |
| 2014 | $1,106 | $38,184 | $10,500 | $27,684 |
Source: Public Records
Map
Nearby Homes
- 774 Hornet Dr
- 784 Hornet Dr
- 1380 Patricia Dr
- 1357 Victoria Dr
- 1359 Victoria Dr
- 798 Hornet Dr
- 737 Hornet Dr
- 1393 Honeybee Ln Unit 6
- 1453 Patricia Dr
- 1341 Mary Jo Dr
- 1370 Rancho Rd
- 737 Bluerock Rd
- 1342 Cahi Cir
- 738 Long Valley Rd
- 1404 James Rd
- 1314 Langley Dr Unit A & B
- 1228 W Cottage Loop
- 888 Dresslerville Rd
- 1291 Bolivia Way
- 916 Tillman Ln
- 658 Leonard Ct
- 656 Leonard Ct
- 660 Carmel Way
- 660 Leonard Ct
- 658 Carmel Way
- 1383 Leonard Rd
- 654 Leonard Ct
- 659 Leonard Ct
- 656 Carmel Way
- 654 Carmel Way
- 652 Leonard Ct
- 653 Leonard Ct Unit 7
- 1375 Leonard Rd
- 652 Carmel Way Unit 7
- 661 Carmel Way
- 650 Leonard Ct
- 1380 Leonard Rd
- 659 Carmel Way
- 650 Carmel Way