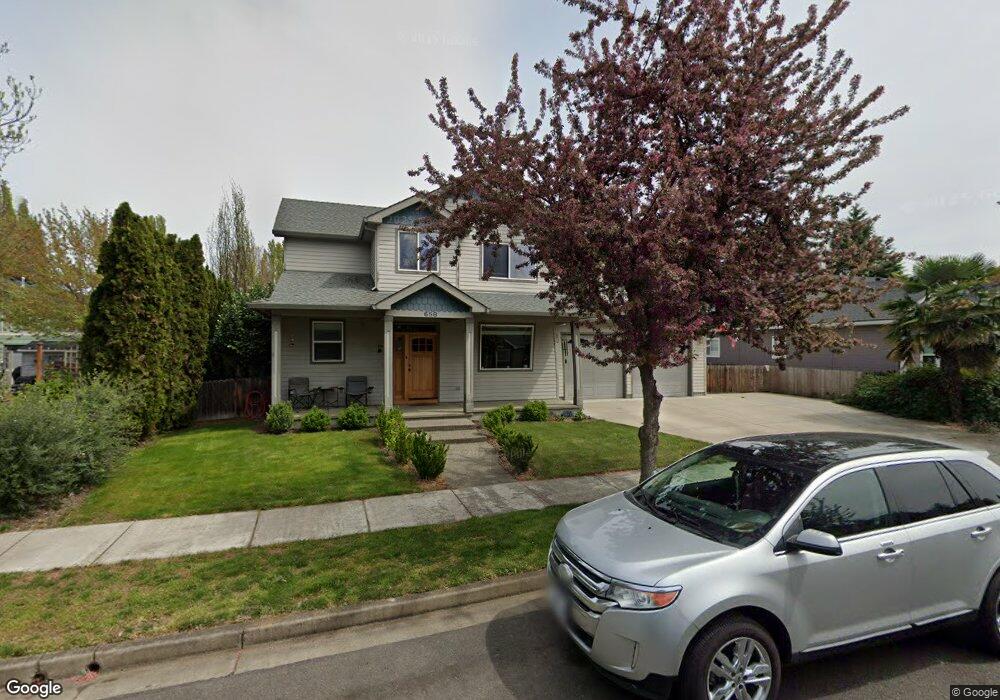
658 Oakley St Central Point, OR 97502
Estimated Value: $540,000 - $703,000
4
Beds
3
Baths
2,623
Sq Ft
$235/Sq Ft
Est. Value
About This Home
This home is located at 658 Oakley St, Central Point, OR 97502 and is currently estimated at $617,472, approximately $235 per square foot. 658 Oakley St is a home located in Jackson County with nearby schools including Richardson Elementary School, Scenic Middle School, and Crater High School.
Ownership History
Date
Name
Owned For
Owner Type
Purchase Details
Closed on
Sep 13, 2016
Sold by
Weber Steven K and Finch Hillary L
Bought by
Oakley Trust
Current Estimated Value
Purchase Details
Closed on
Dec 9, 2015
Sold by
Weber Steven K and Finch Hillary L
Bought by
Oakley Trust
Purchase Details
Closed on
Apr 22, 2008
Sold by
Offord Josh and Offord Jana M
Bought by
Weber Steven K and Finch Hillary L
Home Financials for this Owner
Home Financials are based on the most recent Mortgage that was taken out on this home.
Original Mortgage
$421,387
Interest Rate
6.11%
Mortgage Type
FHA
Purchase Details
Closed on
Mar 24, 2003
Sold by
Grissom Inc
Bought by
Offord Josh and Offord Jana M
Home Financials for this Owner
Home Financials are based on the most recent Mortgage that was taken out on this home.
Original Mortgage
$207,000
Interest Rate
5.82%
Purchase Details
Closed on
Nov 6, 2002
Sold by
Twin Creeks Development Co Llc
Bought by
Grissom Inc
Create a Home Valuation Report for This Property
The Home Valuation Report is an in-depth analysis detailing your home's value as well as a comparison with similar homes in the area
Home Values in the Area
Average Home Value in this Area
Purchase History
| Date | Buyer | Sale Price | Title Company |
|---|---|---|---|
| Oakley Trust | $293,260 | None Available | |
| Oakley Trust | $293,260 | None Available | |
| Weber Steven K | $428,000 | Amerititle | |
| Offord Josh | $280,000 | First American Title Ins Co | |
| Grissom Inc | $59,000 | Key Title Company |
Source: Public Records
Mortgage History
| Date | Status | Borrower | Loan Amount |
|---|---|---|---|
| Previous Owner | Weber Steven K | $421,387 | |
| Previous Owner | Offord Josh | $207,000 |
Source: Public Records
Tax History Compared to Growth
Tax History
| Year | Tax Paid | Tax Assessment Tax Assessment Total Assessment is a certain percentage of the fair market value that is determined by local assessors to be the total taxable value of land and additions on the property. | Land | Improvement |
|---|---|---|---|---|
| 2025 | $5,751 | $345,930 | $120,420 | $225,510 |
| 2024 | $5,751 | $335,860 | $116,920 | $218,940 |
| 2023 | $5,566 | $326,080 | $113,520 | $212,560 |
| 2022 | $5,436 | $326,080 | $113,520 | $212,560 |
| 2021 | $5,281 | $316,590 | $110,210 | $206,380 |
| 2020 | $5,127 | $307,370 | $107,000 | $200,370 |
| 2019 | $5,001 | $289,730 | $100,870 | $188,860 |
| 2018 | $4,848 | $281,300 | $97,940 | $183,360 |
| 2017 | $4,726 | $281,300 | $97,940 | $183,360 |
| 2016 | $4,588 | $265,160 | $92,320 | $172,840 |
| 2015 | $4,396 | $265,160 | $92,320 | $172,840 |
| 2014 | $4,284 | $249,950 | $87,020 | $162,930 |
Source: Public Records
Map
Nearby Homes
- 626 Griffin Oaks Dr
- 407 Silver Creek Dr
- 619 Palo Verde Way
- 1134 Steamboat Dr
- 1135 Shake Dr
- 1167 Boulder Ridge St
- 1159 Rustler Peak St
- 905 Comet Ave
- 342 Hazel St
- 349 W Pine St
- 55 Crater Ln
- 526 Stone Pointe Dr
- 431 N 5th St
- 420 Mayberry Ln
- 4626 N Pacific Hwy
- 629 Bridge Creek Dr
- 1317 River Run St
- 429 Mayberry Ln
- 327 Brookhaven Dr
- 426 Bridge Creek Dr
- 648 Oakley St
- 649 Griffin Oaks Dr
- 641 Griffin Oaks Dr
- 657 Red Oak St
- 647 Red Oak St
- 638 Oakley St
- 633 Griffin Oaks Dr
- 669 Oakley St
- 659 Oakley St
- 649 Oakley St Unit 2
- 637 Red Oak St
- 528 Oakley St
- 646 Griffin Oaks Dr
- 639 Oakley St
- 642 Griffin Oaks Dr Unit 2
- 650 Griffin Oaks Dr Unit 2
- 638 Griffin Oaks Dr
- 634 Griffin Oaks Dr
- 654 Griffin Oaks Dr
- 527 Red Oak St