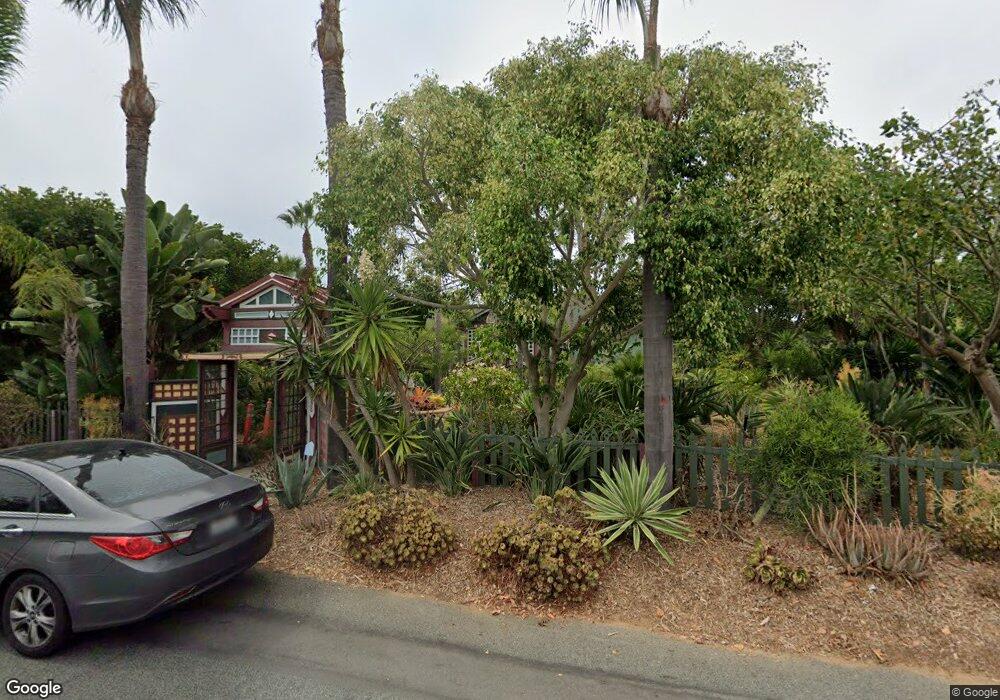
658 Ocean View Ave Encinitas, CA 92024
Leucadia NeighborhoodEstimated Value: $2,635,030 - $3,812,000
3
Beds
3
Baths
3,249
Sq Ft
$986/Sq Ft
Est. Value
About This Home
This home is located at 658 Ocean View Ave, Encinitas, CA 92024 and is currently estimated at $3,203,343, approximately $985 per square foot. 658 Ocean View Ave is a home located in San Diego County with nearby schools including Paul Ecke-Central Elementary, Diegueno Middle School, and La Costa Canyon High School.
Ownership History
Date
Name
Owned For
Owner Type
Purchase Details
Closed on
Nov 16, 2020
Sold by
Waller Kirk S and Waller Caren D
Bought by
Waller Kirk S and Waller Caren D
Current Estimated Value
Home Financials for this Owner
Home Financials are based on the most recent Mortgage that was taken out on this home.
Original Mortgage
$696,000
Outstanding Balance
$619,341
Interest Rate
2.8%
Mortgage Type
New Conventional
Estimated Equity
$2,584,002
Purchase Details
Closed on
Sep 17, 2018
Sold by
Waller Kirk K and Waller Caren D
Bought by
Waller Kirk S and Waller Caren D
Home Financials for this Owner
Home Financials are based on the most recent Mortgage that was taken out on this home.
Original Mortgage
$712,000
Interest Rate
4.3%
Mortgage Type
New Conventional
Purchase Details
Closed on
Apr 30, 1986
Create a Home Valuation Report for This Property
The Home Valuation Report is an in-depth analysis detailing your home's value as well as a comparison with similar homes in the area
Home Values in the Area
Average Home Value in this Area
Purchase History
| Date | Buyer | Sale Price | Title Company |
|---|---|---|---|
| Waller Kirk S | -- | Accommodation | |
| Wailer Kirk S | -- | First American Title Company | |
| Waller Kirk S | -- | Accommodation | |
| Waller Kirk S | -- | First American Title | |
| Waller Kirk S | -- | None Available | |
| -- | $180,000 | -- |
Source: Public Records
Mortgage History
| Date | Status | Borrower | Loan Amount |
|---|---|---|---|
| Open | Wailer Kirk S | $696,000 | |
| Closed | Waller Kirk S | $712,000 |
Source: Public Records
Tax History
| Year | Tax Paid | Tax Assessment Tax Assessment Total Assessment is a certain percentage of the fair market value that is determined by local assessors to be the total taxable value of land and additions on the property. | Land | Improvement |
|---|---|---|---|---|
| 2025 | $5,831 | $560,797 | $238,953 | $321,844 |
| 2024 | $5,831 | $549,802 | $234,268 | $315,534 |
| 2023 | $5,696 | $539,023 | $229,675 | $309,348 |
| 2022 | $5,581 | $528,455 | $225,172 | $303,283 |
| 2021 | $5,509 | $518,094 | $220,757 | $297,337 |
| 2020 | $5,439 | $512,783 | $218,494 | $294,289 |
| 2019 | $5,326 | $502,729 | $214,210 | $288,519 |
| 2018 | $5,219 | $492,872 | $210,010 | $282,862 |
| 2017 | $191 | $483,209 | $205,893 | $277,316 |
| 2016 | $4,955 | $473,735 | $201,856 | $271,879 |
| 2015 | $4,885 | $466,620 | $198,824 | $267,796 |
| 2014 | $4,789 | $457,481 | $194,930 | $262,551 |
Source: Public Records
Map
Nearby Homes
- 697 Ocean View Ave
- 614 Ocean View Ave
- 553 Hygeia Ave
- 0 Fulvia St Unit NDP2505418
- 630 Poinsettia Park N
- 569 Hermes Ave
- 698 Hygeia Ave
- 523 N Vulcan Ave Unit SPC 24A
- 523 N Vulcan Ave Unit 3
- 523 N Vulcan Ave Unit 41
- 523 N Vulcan Ave Unit 43
- 699 N Vulcan Ave
- 699 N Vulcan Ave Unit 133
- 699 N Vulcan Ave Unit 134
- 699 N Vulcan Ave Unit 80
- 699 N Vulcan Ave Unit 56
- 806 Hygeia Ave
- 526 Saxony Rd
- 600 N Coast Highway 101
- 844 Saxony Rd
- 646 Ocean View Ave
- 449 Puebla St
- 439 Puebla St
- 686 Ocean View Ave
- 419 Puebla St
- 630 Ocean View Ave
- 645 Ocean View Ave
- 657 Orpheus Ave
- 657 Orpheus Ave
- 639 Ocean View Ave
- 645 Orpheus Ave
- 649 Orpheus Ave
- 675 Ocean View Ave
- 440 Puebla St
- 665 Orpheus Ave
- 432 Puebla St
- 681 Ocean View Ave
- 468 Puebla St
- 641 Orpheus Ave
- 424 Puebla St
Your Personal Tour Guide
Ask me questions while you tour the home.