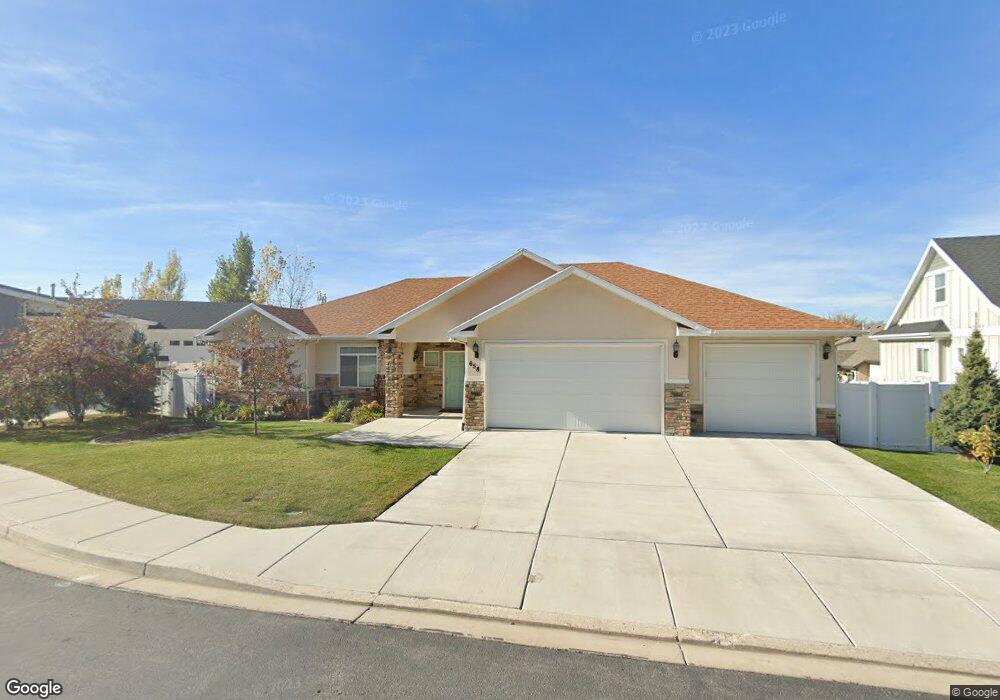
658 S 900 E Pleasant Grove, UT 84062
Estimated Value: $758,112 - $801,000
3
Beds
2
Baths
1,942
Sq Ft
$400/Sq Ft
Est. Value
About This Home
This home is located at 658 S 900 E, Pleasant Grove, UT 84062 and is currently estimated at $777,037, approximately $400 per square foot. 658 S 900 E is a home with nearby schools including Central Elementary School, Oak Canyon Junior High School, and Pleasant Grove High School.
Ownership History
Date
Name
Owned For
Owner Type
Purchase Details
Closed on
May 6, 2015
Sold by
Mll Properties Llc
Bought by
Lightyear Construction And Real Estate L and Lightyear Construction
Current Estimated Value
Home Financials for this Owner
Home Financials are based on the most recent Mortgage that was taken out on this home.
Original Mortgage
$328,000
Outstanding Balance
$252,588
Interest Rate
3.67%
Mortgage Type
Construction
Estimated Equity
$524,449
Create a Home Valuation Report for This Property
The Home Valuation Report is an in-depth analysis detailing your home's value as well as a comparison with similar homes in the area
Home Values in the Area
Average Home Value in this Area
Purchase History
| Date | Buyer | Sale Price | Title Company |
|---|---|---|---|
| Lightyear Construction And Real Estate L | -- | Backman Title Services Ltd |
Source: Public Records
Mortgage History
| Date | Status | Borrower | Loan Amount |
|---|---|---|---|
| Open | Lightyear Construction And Real Estate L | $328,000 |
Source: Public Records
Tax History
| Year | Tax Paid | Tax Assessment Tax Assessment Total Assessment is a certain percentage of the fair market value that is determined by local assessors to be the total taxable value of land and additions on the property. | Land | Improvement |
|---|---|---|---|---|
| 2025 | $3,097 | $398,860 | -- | -- |
| 2024 | $3,097 | $369,600 | $0 | $0 |
| 2023 | $3,014 | $368,280 | $0 | $0 |
| 2022 | $2,901 | $352,715 | $0 | $0 |
| 2021 | $2,550 | $472,000 | $164,200 | $307,800 |
| 2020 | $2,469 | $448,000 | $152,000 | $296,000 |
| 2019 | $2,350 | $440,900 | $144,900 | $296,000 |
| 2018 | $2,188 | $388,200 | $130,800 | $257,400 |
| 2017 | $2,065 | $195,030 | $0 | $0 |
| 2016 | $2,424 | $221,045 | $0 | $0 |
| 2015 | $1,006 | $86,900 | $0 | $0 |
Source: Public Records
Map
Nearby Homes
- 793 E Orchard Dr
- 692 S Juniper Ave
- 696 S Locust Ave
- 1515 E 200 S
- 180 S 950 E
- 897 E 200 S Unit 10
- 1135 E 900 S
- 1176 E 470 S
- 1172 E Murdock Dr
- 286 S 1150 E
- 176 S 1150 E
- 355 W 600 N
- 494 E Apple Blossom Dr
- 642 E Center St
- 517 N 80 W
- 435 E 790 S Unit 8
- 308 E 750 N
- 1515 E 720 S
- 1161 E 200 N
- 557 E 200 N Unit 2
Your Personal Tour Guide
Ask me questions while you tour the home.