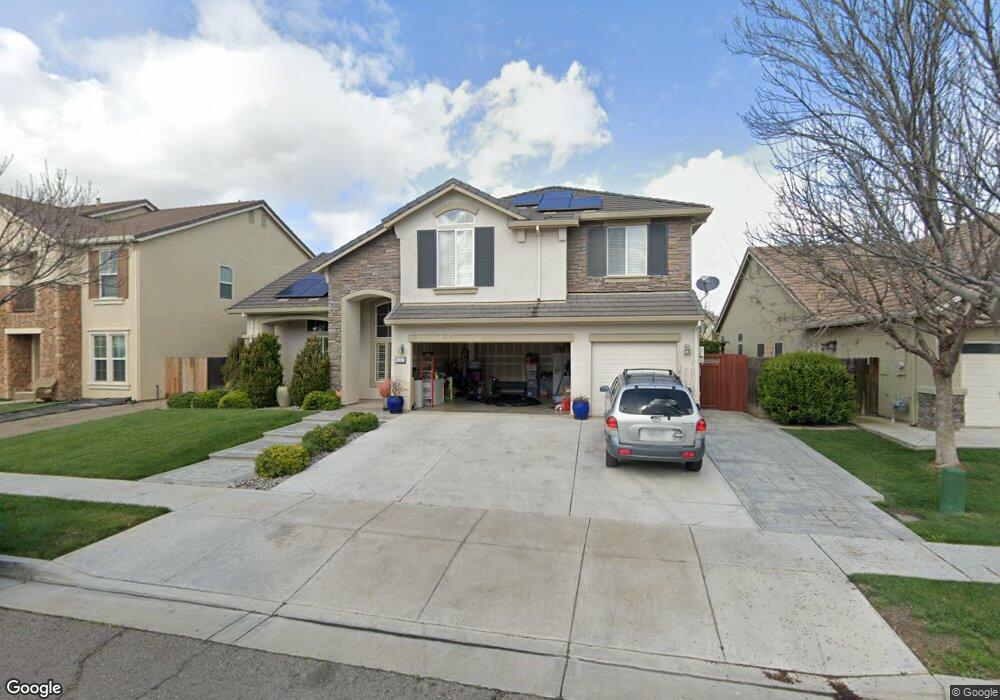
658 Willow Way Los Banos, CA 93635
Estimated Value: $328,000 - $616,000
4
Beds
3
Baths
2,700
Sq Ft
$196/Sq Ft
Est. Value
About This Home
This home is located at 658 Willow Way, Los Banos, CA 93635 and is currently estimated at $528,278, approximately $195 per square foot. 658 Willow Way is a home located in Merced County with nearby schools including Henry Miller Elementary School, Creekside Junior High School, and Los Banos High School.
Ownership History
Date
Name
Owned For
Owner Type
Purchase Details
Closed on
Jul 16, 2011
Sold by
Bank Of America N A
Bought by
Nunes Richard A and Nunes Sandra F
Current Estimated Value
Home Financials for this Owner
Home Financials are based on the most recent Mortgage that was taken out on this home.
Original Mortgage
$175,437
Outstanding Balance
$120,410
Interest Rate
4.46%
Mortgage Type
FHA
Estimated Equity
$407,868
Purchase Details
Closed on
Apr 25, 2011
Sold by
Ngo Phat
Bought by
Bac Home Loans Servicing Lp
Purchase Details
Closed on
Jun 13, 2005
Sold by
Tran Tuan and Ngo Diep
Bought by
Ngo Phat
Home Financials for this Owner
Home Financials are based on the most recent Mortgage that was taken out on this home.
Original Mortgage
$366,400
Interest Rate
1%
Mortgage Type
Negative Amortization
Purchase Details
Closed on
Feb 24, 2005
Sold by
Anderson Homes
Bought by
Tran Tuan and Ngo Diep
Create a Home Valuation Report for This Property
The Home Valuation Report is an in-depth analysis detailing your home's value as well as a comparison with similar homes in the area
Home Values in the Area
Average Home Value in this Area
Purchase History
| Date | Buyer | Sale Price | Title Company |
|---|---|---|---|
| Nunes Richard A | $180,000 | Fidelity Natl Title Co Of Ca | |
| Bac Home Loans Servicing Lp | $172,450 | First American Title Company | |
| Ngo Phat | $244,500 | Chicago Title Company | |
| Tran Tuan | $458,500 | Alliance Title Company |
Source: Public Records
Mortgage History
| Date | Status | Borrower | Loan Amount |
|---|---|---|---|
| Open | Nunes Richard A | $175,437 | |
| Previous Owner | Ngo Phat | $366,400 | |
| Closed | Tran Tuan | $0 |
Source: Public Records
Tax History Compared to Growth
Tax History
| Year | Tax Paid | Tax Assessment Tax Assessment Total Assessment is a certain percentage of the fair market value that is determined by local assessors to be the total taxable value of land and additions on the property. | Land | Improvement |
|---|---|---|---|---|
| 2025 | $3,251 | $226,075 | $16,322 | $209,753 |
| 2024 | $3,251 | $221,643 | $16,002 | $205,641 |
| 2023 | $3,069 | $217,298 | $15,689 | $201,609 |
| 2022 | $2,992 | $213,038 | $15,382 | $197,656 |
| 2021 | $2,935 | $208,862 | $15,081 | $193,781 |
| 2020 | $2,884 | $206,722 | $14,927 | $191,795 |
| 2019 | $2,823 | $202,670 | $14,635 | $188,035 |
| 2018 | $2,736 | $198,698 | $14,349 | $184,349 |
| 2017 | $2,695 | $194,803 | $14,068 | $180,735 |
| 2016 | $2,692 | $190,985 | $13,793 | $177,192 |
| 2015 | $2,622 | $188,117 | $13,586 | $174,531 |
| 2014 | $2,540 | $184,433 | $13,320 | $171,113 |
Source: Public Records
Map
Nearby Homes
- 662 Willow Way
- 683 Alder Ln
- 1622 Fir Dr
- 1631 Fir Dr
- 1502 Paradise Ln
- 859 Sandra St
- 942 Garden St
- 1010 Neal St
- 1036 Sandra St
- 1227 California Ave
- 1130 Delaware Ave
- 506 M St
- 651 Pinelli Dr
- 1117 Iowa Ave
- 642 Adams Ave
- 709 Madison Ave
- 1862 Dunite Dr
- 1149 Bellflower Way
- 1102 California Ave
- 1016 Maryland Ave
- 656 Willow Way
- 660 Willow Way
- 1671 Locust Ct
- 654 Willow Way
- 1674 Locust Ct
- 661 Willow Way
- 1677 Mesquite Ct
- 1673 Poplar Ct
- 1673 Locust Ct
- 659 Willow Way
- 664 Willow Way
- 657 Willow Way
- 1675 Mesquite Ct
- 1675 Poplar Ct
- 1676 Locust Ct
- 1671 Poplar Ct
- 1675 Locust Ct
- 1673 Mesquite Ct
- 668 Willow Way
- 1677 Poplar Ct