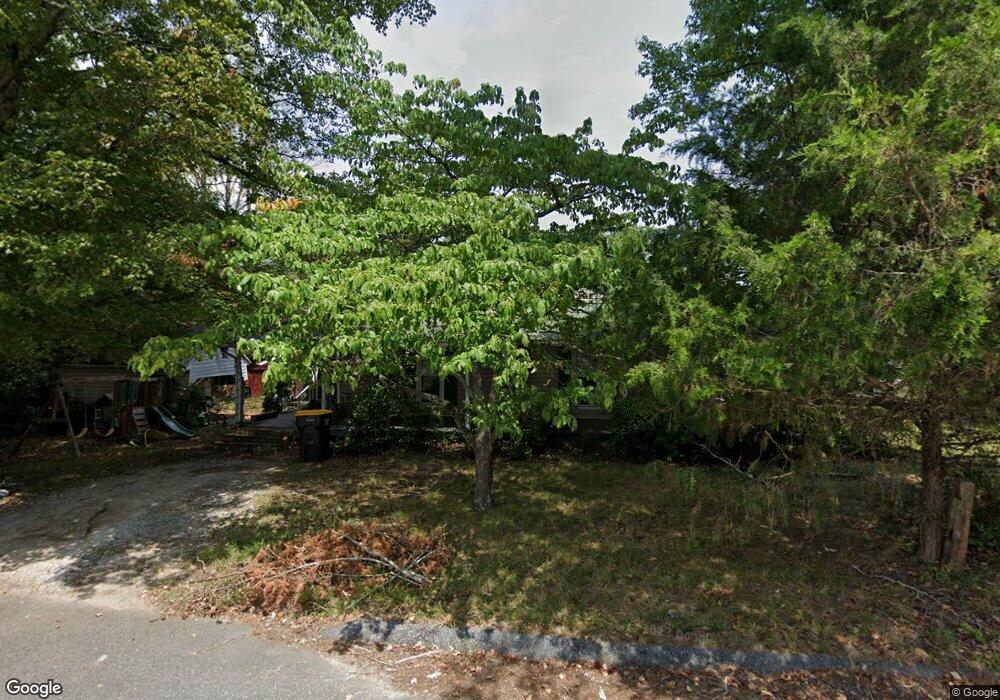
6589 Cedar Rd Denver, NC 28037
Estimated Value: $273,000 - $387,000
2
Beds
1
Bath
1,460
Sq Ft
$230/Sq Ft
Est. Value
About This Home
This home is located at 6589 Cedar Rd, Denver, NC 28037 and is currently estimated at $335,255, approximately $229 per square foot. 6589 Cedar Rd is a home located in Lincoln County with nearby schools including Rock Springs Elementary School, North Lincoln Middle School, and North Lincoln High School.
Ownership History
Date
Name
Owned For
Owner Type
Purchase Details
Closed on
Apr 29, 2015
Sold by
Mann David A and Mann Lynn M
Bought by
Mccarthy Jason Ray and Mccarthy Marcia E
Current Estimated Value
Home Financials for this Owner
Home Financials are based on the most recent Mortgage that was taken out on this home.
Original Mortgage
$127,448
Outstanding Balance
$98,854
Interest Rate
3.87%
Mortgage Type
New Conventional
Estimated Equity
$236,401
Purchase Details
Closed on
Feb 7, 2005
Sold by
Powell Roberat C and Powell Derriann C
Bought by
Mann David A and Mann Lynn M
Home Financials for this Owner
Home Financials are based on the most recent Mortgage that was taken out on this home.
Original Mortgage
$99,920
Interest Rate
5.66%
Mortgage Type
New Conventional
Purchase Details
Closed on
Mar 12, 2002
Bought by
Powell Robert C and Powel Derriann C
Purchase Details
Closed on
Jul 17, 2001
Bought by
Barker Joel B and Brotherton Terry L
Create a Home Valuation Report for This Property
The Home Valuation Report is an in-depth analysis detailing your home's value as well as a comparison with similar homes in the area
Home Values in the Area
Average Home Value in this Area
Purchase History
| Date | Buyer | Sale Price | Title Company |
|---|---|---|---|
| Mccarthy Jason Ray | $125,000 | None Available | |
| Mann David A | $125,000 | None Available | |
| Powell Robert C | $92,000 | -- | |
| Barker Joel B | $90,000 | -- |
Source: Public Records
Mortgage History
| Date | Status | Borrower | Loan Amount |
|---|---|---|---|
| Open | Mccarthy Jason Ray | $127,448 | |
| Previous Owner | Mann David A | $99,920 |
Source: Public Records
Tax History
| Year | Tax Paid | Tax Assessment Tax Assessment Total Assessment is a certain percentage of the fair market value that is determined by local assessors to be the total taxable value of land and additions on the property. | Land | Improvement |
|---|---|---|---|---|
| 2025 | $1,770 | $269,432 | $40,000 | $229,432 |
| 2024 | $1,745 | $269,432 | $40,000 | $229,432 |
| 2023 | $1,745 | $269,432 | $40,000 | $229,432 |
| 2022 | $1,130 | $136,986 | $32,000 | $104,986 |
| 2021 | $1,120 | $136,986 | $32,000 | $104,986 |
| 2020 | $978 | $136,986 | $32,000 | $104,986 |
| 2019 | $978 | $136,986 | $32,000 | $104,986 |
| 2018 | $890 | $108,704 | $30,000 | $78,704 |
| 2017 | $789 | $108,704 | $30,000 | $78,704 |
| 2016 | $740 | $102,254 | $23,550 | $78,704 |
| 2015 | $844 | $102,254 | $23,550 | $78,704 |
| 2014 | $1,022 | $129,104 | $50,400 | $78,704 |
Source: Public Records
Map
Nearby Homes
- 6444 Bellwood Ln
- 5327 Pembrey Dr
- 00 N Nc 16 Business Hwy
- 19.9 +/- Acres Nc Hwy 16 Business Hwy
- 5351 Pembrey Dr
- 5135 Devonshire Rd
- 1952 N Nc 16 Business Hwy
- 530 N Nc 16 Business Hwy Unit 1 & 2
- 3910 Azalea Trail
- 3900 Azalea Trail
- 6295 Pansy Trail
- 6464 Winding Creek Ln
- 6444 Winding Creek Ln
- 3878 Sage Ct
- 3870 Sage Ct
- 3366 Saint James Church Rd
- 3127 Spring Iris Dr
- 3111 Spring Iris Dr
- 3117 Spring Iris Dr
- 3121 Spring Iris Dr
- 6663 Campground Rd
- 6637 Campground Rd
- 6681 Campground Rd
- 6664 Campground Rd
- 6547 Cedar Rd
- 6672 Campground Rd
- 6639 Campground Rd
- 6455 Bentwood Ln
- 6682 Campground Rd
- 6636 Campground Rd
- 3953 Will Proctor St
- 6703 Campground Rd
- 3963 Will Proctor St
- 6539 Cedar Rd
- 6708 Campground Rd
- 3973 Will Proctor St
- 6540 Cedar Rd
- 3987 Will Proctor St
- 6529 Cedar Rd
- 6608 Campground Rd
Your Personal Tour Guide
Ask me questions while you tour the home.