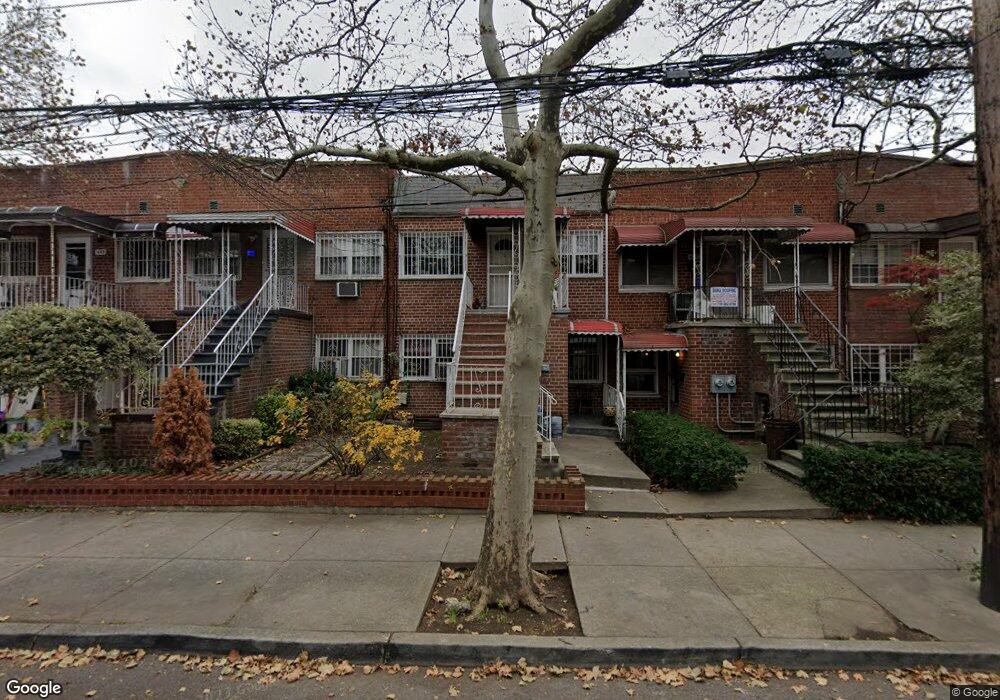
659 E 82nd St Brooklyn, NY 11236
Canarsie NeighborhoodEstimated Value: $601,000 - $894,000
Studio
--
Bath
1,800
Sq Ft
$421/Sq Ft
Est. Value
About This Home
This home is located at 659 E 82nd St, Brooklyn, NY 11236 and is currently estimated at $758,415, approximately $421 per square foot. 659 E 82nd St is a home located in Kings County with nearby schools including P.S. 114 Ryder Elementary School, Is 68 Isaac Bildersee, and Explore Excel Charter School.
Ownership History
Date
Name
Owned For
Owner Type
Purchase Details
Closed on
May 19, 2005
Sold by
Borgella Roodphil
Bought by
Borgella Roodphil and Chaumette Marlene
Current Estimated Value
Purchase Details
Closed on
May 19, 2003
Sold by
Daquin Louis L and Daquin Therese
Bought by
Borgella Roodphil
Home Financials for this Owner
Home Financials are based on the most recent Mortgage that was taken out on this home.
Original Mortgage
$280,000
Interest Rate
6.22%
Mortgage Type
Purchase Money Mortgage
Create a Home Valuation Report for This Property
The Home Valuation Report is an in-depth analysis detailing your home's value as well as a comparison with similar homes in the area
Home Values in the Area
Average Home Value in this Area
Purchase History
| Date | Buyer | Sale Price | Title Company |
|---|---|---|---|
| Borgella Roodphil | -- | -- | |
| Borgella Roodphil | -- | -- | |
| Borgella Roodphil | $350,000 | -- | |
| Borgella Roodphil | $350,000 | -- |
Source: Public Records
Mortgage History
| Date | Status | Borrower | Loan Amount |
|---|---|---|---|
| Previous Owner | Borgella Roodphil | $280,000 | |
| Closed | Borgella Roodphil | $52,500 | |
| Closed | Borgella Roodphil | $0 |
Source: Public Records
Tax History
| Year | Tax Paid | Tax Assessment Tax Assessment Total Assessment is a certain percentage of the fair market value that is determined by local assessors to be the total taxable value of land and additions on the property. | Land | Improvement |
|---|---|---|---|---|
| 2025 | $7,940 | $39,540 | $10,920 | $28,620 |
| 2024 | $7,940 | $46,500 | $10,920 | $35,580 |
| 2023 | $7,574 | $49,620 | $10,920 | $38,700 |
| 2022 | $7,272 | $45,900 | $10,920 | $34,980 |
| 2021 | $7,629 | $38,040 | $10,920 | $27,120 |
| 2020 | $3,578 | $36,660 | $10,920 | $25,740 |
| 2019 | $6,892 | $35,280 | $10,920 | $24,360 |
| 2018 | $6,336 | $31,080 | $10,920 | $20,160 |
| 2017 | $6,188 | $30,356 | $9,592 | $20,764 |
| 2016 | $6,039 | $30,210 | $9,942 | $20,268 |
| 2015 | $3,454 | $28,500 | $11,340 | $17,160 |
| 2014 | $3,454 | $27,840 | $10,237 | $17,603 |
Source: Public Records
Map
Nearby Homes
Your Personal Tour Guide
Ask me questions while you tour the home.