Estimated Value: $130,000 - $144,271
3
Beds
2
Baths
1,505
Sq Ft
$92/Sq Ft
Est. Value
About This Home
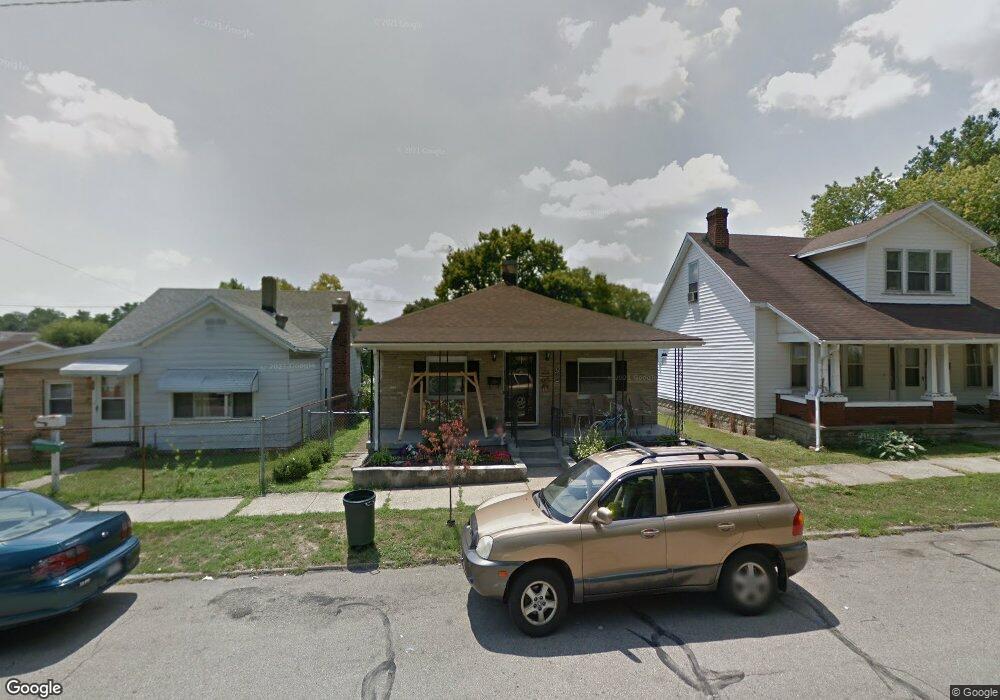
This home is located at 659 E Market St, Xenia, OH 45385 and is currently estimated at $139,068, approximately $92 per square foot. 659 E Market St is a home located in Greene County with nearby schools including Xenia High School, Summit Academy Community School for Alternative Learners - Xenia, and Legacy Christian Academy.
Ownership History
Date
Name
Owned For
Owner Type
Purchase Details
Closed on
Mar 7, 2025
Sold by
Howard Kenny and Howard Christina A
Bought by
Hubbard Derrick
Current Estimated Value
Home Financials for this Owner
Home Financials are based on the most recent Mortgage that was taken out on this home.
Original Mortgage
$93,750
Outstanding Balance
$93,260
Interest Rate
6.76%
Mortgage Type
Construction
Estimated Equity
$45,808
Purchase Details
Closed on
Nov 22, 2004
Sold by
Mcclendon Juanita Savage and Hubbard Judith M
Bought by
Howard Kenny
Purchase Details
Closed on
Apr 17, 2003
Sold by
Savage Jerome F
Bought by
Mcclendon Juanita S and Mcclendon Juanita Savage
Purchase Details
Closed on
Apr 16, 2003
Sold by
Hubbard Judith M and Williams Kary
Bought by
Mcclendon Juanita and Mcclendon Juanita Savage
Create a Home Valuation Report for This Property
The Home Valuation Report is an in-depth analysis detailing your home's value as well as a comparison with similar homes in the area
Home Values in the Area
Average Home Value in this Area
Purchase History
| Date | Buyer | Sale Price | Title Company |
|---|---|---|---|
| Hubbard Derrick | $125,000 | Liberty Title | |
| Howard Kenny | $47,000 | -- | |
| Mcclendon Juanita S | -- | -- | |
| Mcclendon Juanita | -- | -- |
Source: Public Records
Mortgage History
| Date | Status | Borrower | Loan Amount |
|---|---|---|---|
| Open | Hubbard Derrick | $93,750 |
Source: Public Records
Tax History Compared to Growth
Tax History
| Year | Tax Paid | Tax Assessment Tax Assessment Total Assessment is a certain percentage of the fair market value that is determined by local assessors to be the total taxable value of land and additions on the property. | Land | Improvement |
|---|---|---|---|---|
| 2024 | $880 | $20,560 | $1,580 | $18,980 |
| 2023 | $880 | $20,560 | $1,580 | $18,980 |
| 2022 | $732 | $14,590 | $1,440 | $13,150 |
| 2021 | $742 | $14,590 | $1,440 | $13,150 |
| 2020 | $711 | $14,590 | $1,440 | $13,150 |
| 2019 | $648 | $12,530 | $1,450 | $11,080 |
| 2018 | $651 | $12,530 | $1,450 | $11,080 |
| 2017 | $636 | $12,530 | $1,450 | $11,080 |
| 2016 | $637 | $12,030 | $1,450 | $10,580 |
| 2015 | $639 | $12,030 | $1,450 | $10,580 |
| 2014 | $611 | $12,030 | $1,450 | $10,580 |
Source: Public Records
Map
Nearby Homes
- 667 E Market St
- 651 E Market St
- 683 E Market St
- 51 N Williams Ave
- 631 E Market St
- 37 N Williams Ave
- 660 E Main St
- 652 E Main St
- 697 E Market St
- 646 E Main St
- 621 E Market St
- 668 E Market St
- 674 E Market St
- 705 E Market St
- 613 E Market St
- 676 E Main St
- 622 E Market St
- 630 E Market St
- 686 E Market St
- 706 E Main St