Estimated Value: $378,000 - $442,000
2
Beds
1
Bath
1,010
Sq Ft
$412/Sq Ft
Est. Value
About This Home
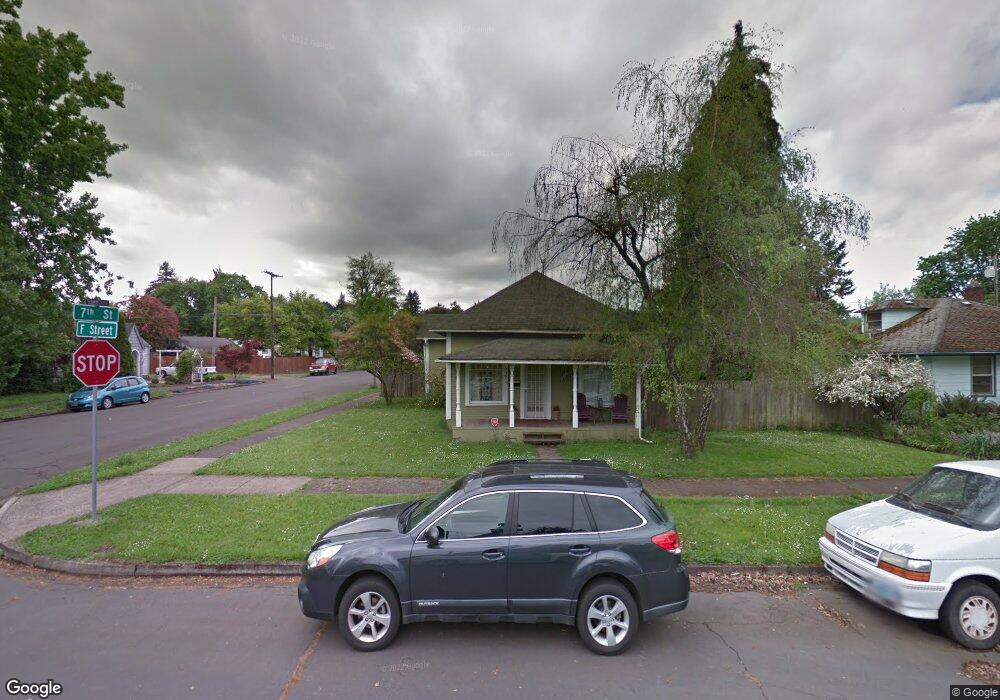
This home is located at 659 F St, Springfield, OR 97477 and is currently estimated at $415,775, approximately $411 per square foot. 659 F St is a home located in Lane County with nearby schools including Two Rivers Dos Rios Elementary School, Hamlin Middle School, and Springfield High School.
Ownership History
Date
Name
Owned For
Owner Type
Purchase Details
Closed on
Nov 4, 2024
Sold by
Kedmore Llc and Kedmor Llc
Bought by
Strochic Sabina Julia
Current Estimated Value
Purchase Details
Closed on
Oct 7, 2016
Sold by
Eec Holding Llc
Bought by
Kedmore Llc
Purchase Details
Closed on
Jun 28, 2016
Sold by
Lee Joann
Bought by
Eec Holding Llc
Purchase Details
Closed on
Feb 8, 2016
Sold by
Stacy Charlene
Bought by
Lee Joann
Purchase Details
Closed on
Feb 4, 2016
Sold by
Lee Joann
Bought by
Lee Joann and Stacy Charlene
Create a Home Valuation Report for This Property
The Home Valuation Report is an in-depth analysis detailing your home's value as well as a comparison with similar homes in the area
Home Values in the Area
Average Home Value in this Area
Purchase History
| Date | Buyer | Sale Price | Title Company |
|---|---|---|---|
| Strochic Sabina Julia | $420,000 | Cascade Title | |
| Kedmore Llc | -- | None Available | |
| Eec Holding Llc | $162,000 | Cascade Title Company | |
| Lee Joann | -- | None Available | |
| Lee Joann | -- | None Available |
Source: Public Records
Tax History Compared to Growth
Tax History
| Year | Tax Paid | Tax Assessment Tax Assessment Total Assessment is a certain percentage of the fair market value that is determined by local assessors to be the total taxable value of land and additions on the property. | Land | Improvement |
|---|---|---|---|---|
| 2025 | $2,145 | $116,958 | -- | -- |
| 2024 | $2,110 | $113,552 | -- | -- |
| 2023 | $2,110 | $110,245 | $0 | $0 |
| 2022 | $1,954 | $107,034 | $0 | $0 |
| 2021 | $1,919 | $103,917 | $0 | $0 |
| 2020 | $1,863 | $100,891 | $0 | $0 |
| 2019 | $1,807 | $97,953 | $0 | $0 |
| 2018 | $1,703 | $92,330 | $0 | $0 |
| 2017 | $1,638 | $92,330 | $0 | $0 |
| 2016 | $1,604 | $89,641 | $0 | $0 |
| 2015 | $1,558 | $87,030 | $0 | $0 |
| 2014 | $1,534 | $84,495 | $0 | $0 |
Source: Public Records
Map
Nearby Homes