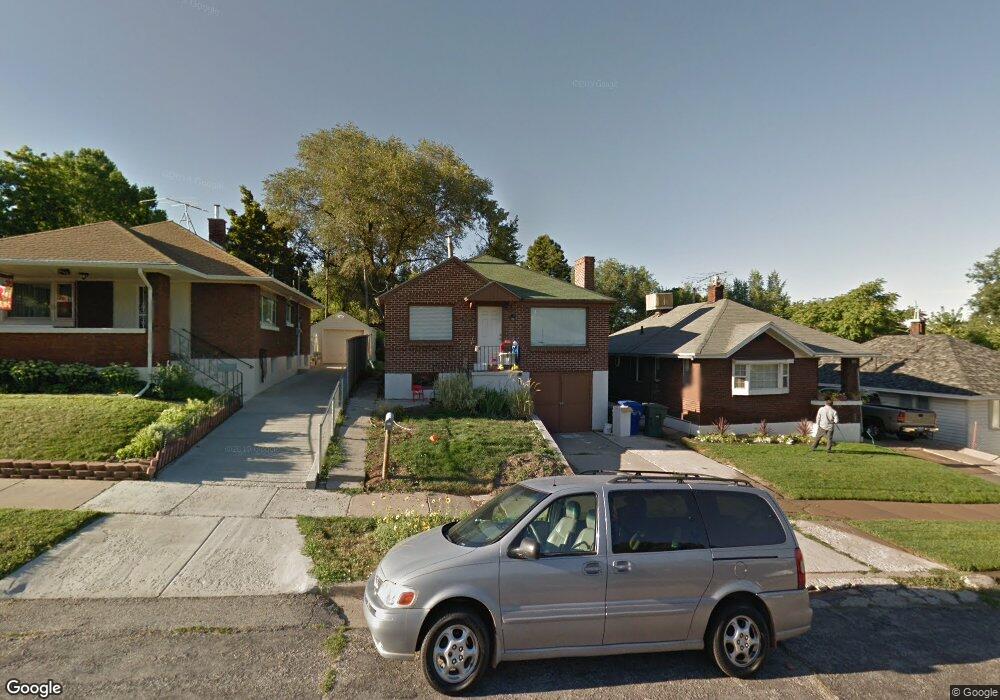
659 Kershaw St Ogden, UT 84403
TO Smith NeighborhoodEstimated Value: $270,000 - $347,000
3
Beds
1
Bath
1,376
Sq Ft
$228/Sq Ft
Est. Value
About This Home
This home is located at 659 Kershaw St, Ogden, UT 84403 and is currently estimated at $313,481, approximately $227 per square foot. 659 Kershaw St is a home located in Weber County with nearby schools including Mount Ogden Junior High School, Ogden High School, and St Joseph Catholic School.
Ownership History
Date
Name
Owned For
Owner Type
Purchase Details
Closed on
Sep 12, 2019
Sold by
Reynolds Johnathan W
Bought by
Francom Landon D
Current Estimated Value
Home Financials for this Owner
Home Financials are based on the most recent Mortgage that was taken out on this home.
Original Mortgage
$180,667
Outstanding Balance
$157,494
Interest Rate
3.37%
Mortgage Type
FHA
Estimated Equity
$155,987
Purchase Details
Closed on
Oct 26, 2009
Sold by
Freestone Group Lc
Bought by
Reynolds Johnathan W
Home Financials for this Owner
Home Financials are based on the most recent Mortgage that was taken out on this home.
Original Mortgage
$5,000
Interest Rate
5%
Mortgage Type
Purchase Money Mortgage
Purchase Details
Closed on
May 7, 2009
Sold by
Hanson Eric
Bought by
Freestone Group Lc
Home Financials for this Owner
Home Financials are based on the most recent Mortgage that was taken out on this home.
Original Mortgage
$89,540
Interest Rate
4.8%
Mortgage Type
Purchase Money Mortgage
Purchase Details
Closed on
Dec 19, 2005
Sold by
Chapman Jay A
Bought by
Chapman Marlene J
Create a Home Valuation Report for This Property
The Home Valuation Report is an in-depth analysis detailing your home's value as well as a comparison with similar homes in the area
Home Values in the Area
Average Home Value in this Area
Purchase History
| Date | Buyer | Sale Price | Title Company |
|---|---|---|---|
| Francom Landon D | -- | Stewart Title Ins Agcy Of | |
| Reynolds Johnathan W | -- | First American Fashion Point | |
| Freestone Group Lc | -- | Weber Title | |
| Chapman Marlene J | -- | -- |
Source: Public Records
Mortgage History
| Date | Status | Borrower | Loan Amount |
|---|---|---|---|
| Open | Francom Landon D | $180,667 | |
| Previous Owner | Reynolds Johnathan W | $5,000 | |
| Previous Owner | Freestone Group Lc | $89,540 |
Source: Public Records
Tax History Compared to Growth
Tax History
| Year | Tax Paid | Tax Assessment Tax Assessment Total Assessment is a certain percentage of the fair market value that is determined by local assessors to be the total taxable value of land and additions on the property. | Land | Improvement |
|---|---|---|---|---|
| 2025 | $1,911 | $154,050 | $57,757 | $96,293 |
| 2024 | $1,938 | $153,449 | $57,756 | $95,693 |
| 2023 | $2,008 | $160,050 | $52,125 | $107,925 |
| 2022 | $2,134 | $170,500 | $46,752 | $123,748 |
| 2021 | $1,591 | $211,000 | $45,049 | $165,951 |
| 2020 | $1,282 | $157,000 | $35,009 | $121,991 |
| 2019 | $1,200 | $138,000 | $29,932 | $108,068 |
| 2018 | $954 | $109,000 | $24,022 | $84,978 |
| 2017 | $881 | $94,000 | $24,022 | $69,978 |
| 2016 | $781 | $45,068 | $10,601 | $34,467 |
| 2015 | $686 | $38,640 | $10,601 | $28,039 |
| 2014 | $668 | $36,910 | $10,601 | $26,309 |
Source: Public Records
Map
Nearby Homes
- 635 Kershaw St
- 2838 Jefferson Ave
- 3608 S Orchard Ave
- 726 29th St
- 2873 Liberty Ave
- 2829 Liberty Ave
- 660 28th St
- 2927 Jefferson Ave
- 2852 Porter Ave
- 769 28th St
- 661 E 2735 S
- 2982 S Madison Ave
- 718 30th St
- 724 30th St
- 645 30th St
- 824 29th St
- 2711 Liberty Ave Unit A1,2,3
- 551 27th St
- 762 Patterson St
- 2664 Liberty Ave