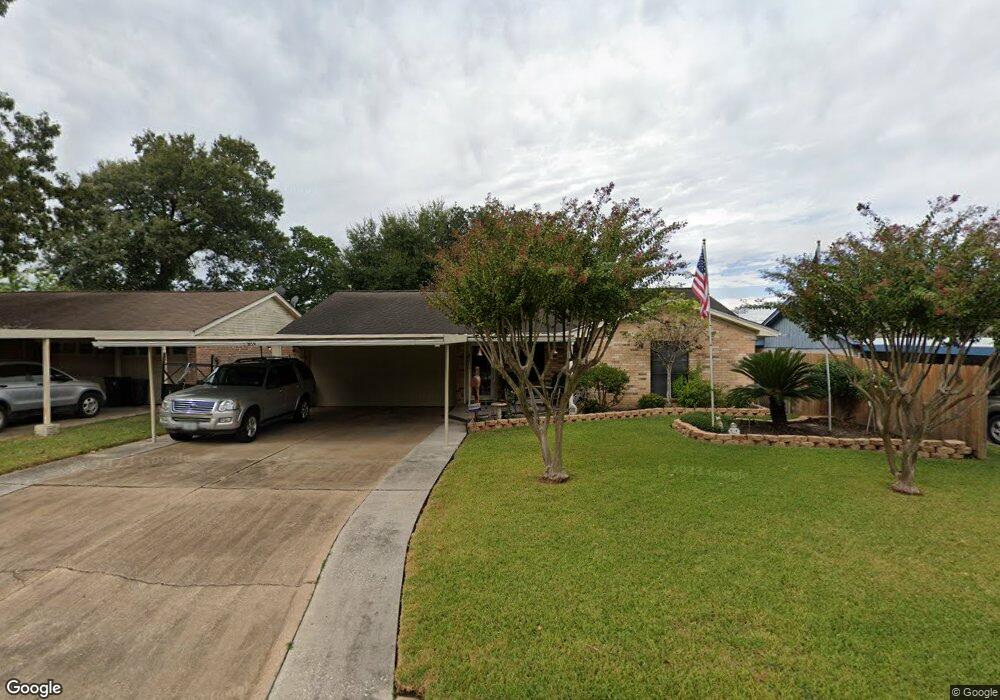
659 Overbluff St Channelview, TX 77530
Estimated Value: $187,000 - $207,000
3
Beds
2
Baths
1,484
Sq Ft
$133/Sq Ft
Est. Value
About This Home
This home is located at 659 Overbluff St, Channelview, TX 77530 and is currently estimated at $197,633, approximately $133 per square foot. 659 Overbluff St is a home located in Harris County with nearby schools including Channelview High School, Family Christian Academy, and Creative Corner.
Create a Home Valuation Report for This Property
The Home Valuation Report is an in-depth analysis detailing your home's value as well as a comparison with similar homes in the area
Home Values in the Area
Average Home Value in this Area
Tax History
| Year | Tax Paid | Tax Assessment Tax Assessment Total Assessment is a certain percentage of the fair market value that is determined by local assessors to be the total taxable value of land and additions on the property. | Land | Improvement |
|---|---|---|---|---|
| 2025 | $3,147 | $174,512 | $40,915 | $133,597 |
| 2024 | $3,147 | $174,512 | $40,915 | $133,597 |
| 2023 | $30 | $185,298 | $40,915 | $144,383 |
| 2022 | $3,704 | $168,729 | $40,915 | $127,814 |
| 2021 | $3,514 | $139,700 | $40,915 | $98,785 |
| 2020 | $3,408 | $127,016 | $35,655 | $91,361 |
| 2019 | $3,188 | $110,045 | $27,472 | $82,573 |
| 2018 | $135 | $90,270 | $18,120 | $72,150 |
| 2017 | $2,910 | $90,270 | $18,120 | $72,150 |
| 2016 | $2,759 | $90,270 | $18,120 | $72,150 |
| 2015 | $256 | $82,600 | $9,060 | $73,540 |
| 2014 | $256 | $75,944 | $9,060 | $66,884 |
Source: Public Records
Map
Nearby Homes
- 14902 Woodford St
- 14923 Lofton St
- 634 Bright Penny Ln
- 726 Brookview St
- 623 Rockbrook Dr
- 627 Rockbrook Dr
- 707 Doncrest St
- 714 Donfield St
- 827 Dondell St
- 15116 Sheffield Terrace
- 730 Stonyridge St
- 15122 Sheffield Terrace
- 14613 Hillsboro St
- 639 Manor St
- 830 Stonyridge St
- 910 Littleport Ln
- 830 Hollycrest St
- 826 Ivy Hollow St
- 722 Canna St
- 14506 Corpus Christi St Unit 4
- 655 Overbluff St
- 663 Overbluff St
- 667 Overbluff St
- 651 Overbluff St
- 647 Overbluff St
- 671 Overbluff St
- 658 Overbluff St
- 643 Overbluff St
- 654 Overbluff St
- 662 Overbluff St
- 675 Overbluff St
- 691 Bright Penny Ln
- 650 Overbluff St
- 666 Overbluff St
- 695 Bright Penny Ln
- 14903 Gloster Dr
- 646 Overbluff St
- 679 Overbluff St
- 670 Overbluff St
- 639 Overbluff St
Your Personal Tour Guide
Ask me questions while you tour the home.