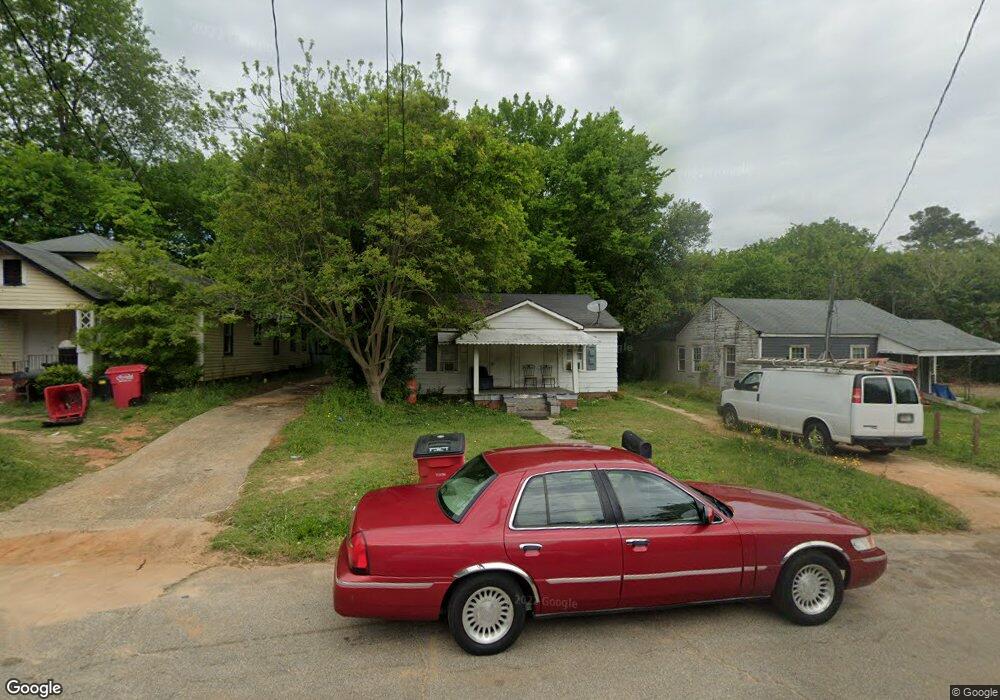
659 Paul St Macon, GA 31206
Estimated Value: $51,000 - $80,000
2
Beds
1
Bath
1,022
Sq Ft
$63/Sq Ft
Est. Value
About This Home
This home is located at 659 Paul St, Macon, GA 31206 and is currently estimated at $64,717, approximately $63 per square foot. 659 Paul St is a home located in Bibb County with nearby schools including Bruce Elementary School, Rutland Middle School, and Rutland High School.
Ownership History
Date
Name
Owned For
Owner Type
Purchase Details
Closed on
Dec 12, 2024
Sold by
Million Property Llc
Bought by
Dubois Kendra
Current Estimated Value
Home Financials for this Owner
Home Financials are based on the most recent Mortgage that was taken out on this home.
Original Mortgage
$57,000
Interest Rate
6.72%
Mortgage Type
Seller Take Back
Purchase Details
Closed on
Oct 11, 2024
Sold by
Hlm Investments Llc
Bought by
Million Property Llc
Purchase Details
Closed on
Jun 11, 2003
Bought by
Hlm Investments Llc
Purchase Details
Closed on
Feb 13, 2001
Purchase Details
Closed on
Aug 10, 1999
Create a Home Valuation Report for This Property
The Home Valuation Report is an in-depth analysis detailing your home's value as well as a comparison with similar homes in the area
Home Values in the Area
Average Home Value in this Area
Purchase History
| Date | Buyer | Sale Price | Title Company |
|---|---|---|---|
| Dubois Kendra | $64,000 | None Listed On Document | |
| Dubois Kendra | $64,000 | None Listed On Document | |
| Million Property Llc | $33,000 | None Listed On Document | |
| Million Property Llc | $33,000 | None Listed On Document | |
| Hlm Investments Llc | -- | -- | |
| -- | $35,000 | -- | |
| -- | $19,000 | -- |
Source: Public Records
Mortgage History
| Date | Status | Borrower | Loan Amount |
|---|---|---|---|
| Previous Owner | Dubois Kendra | $57,000 |
Source: Public Records
Tax History Compared to Growth
Tax History
| Year | Tax Paid | Tax Assessment Tax Assessment Total Assessment is a certain percentage of the fair market value that is determined by local assessors to be the total taxable value of land and additions on the property. | Land | Improvement |
|---|---|---|---|---|
| 2025 | $571 | $23,217 | $2,300 | $20,917 |
| 2024 | $564 | $22,211 | $2,300 | $19,911 |
| 2023 | $658 | $22,211 | $2,300 | $19,911 |
| 2022 | $444 | $12,828 | $1,117 | $11,711 |
| 2021 | $290 | $7,629 | $1,005 | $6,624 |
| 2020 | $253 | $6,529 | $1,005 | $5,524 |
| 2019 | $256 | $6,529 | $1,005 | $5,524 |
| 2018 | $517 | $5,618 | $782 | $4,836 |
| 2017 | $211 | $5,618 | $782 | $4,836 |
| 2016 | $194 | $5,618 | $782 | $4,836 |
| 2015 | $309 | $6,305 | $782 | $5,524 |
| 2014 | $572 | $10,160 | $894 | $9,266 |
Source: Public Records
Map
Nearby Homes