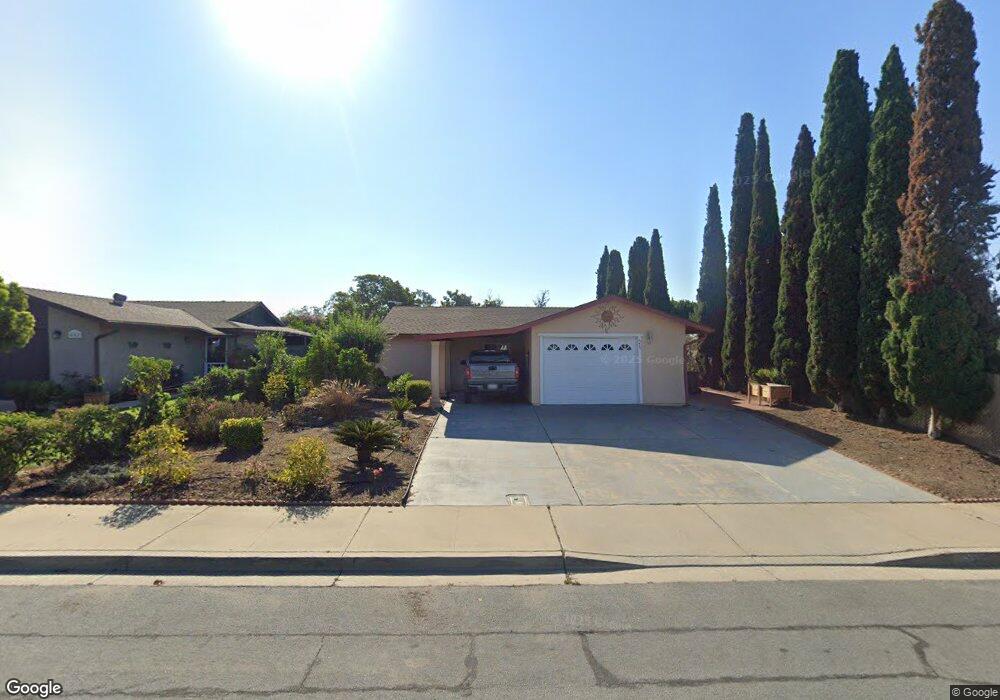
659 Quito St Nipomo, CA 93444
Estimated Value: $608,639 - $848,000
3
Beds
1
Bath
1,092
Sq Ft
$650/Sq Ft
Est. Value
About This Home
This home is located at 659 Quito St, Nipomo, CA 93444 and is currently estimated at $709,660, approximately $649 per square foot. 659 Quito St is a home located in San Luis Obispo County with nearby schools including Dorothea Lange Elementary School, Mesa Middle School, and Nipomo High School.
Ownership History
Date
Name
Owned For
Owner Type
Purchase Details
Closed on
Jan 19, 2006
Sold by
Montoya Tomas and Montoya Dolores
Bought by
Zavala Hipolito Lemus and Delemus Maria R
Current Estimated Value
Home Financials for this Owner
Home Financials are based on the most recent Mortgage that was taken out on this home.
Original Mortgage
$60,000
Interest Rate
6.16%
Mortgage Type
Unknown
Create a Home Valuation Report for This Property
The Home Valuation Report is an in-depth analysis detailing your home's value as well as a comparison with similar homes in the area
Home Values in the Area
Average Home Value in this Area
Purchase History
| Date | Buyer | Sale Price | Title Company |
|---|---|---|---|
| Zavala Hipolito Lemus | $400,000 | First American Title Co |
Source: Public Records
Mortgage History
| Date | Status | Borrower | Loan Amount |
|---|---|---|---|
| Closed | Zavala Hipolito Lemus | $60,000 | |
| Open | Zavala Hipolito Lemus | $320,000 |
Source: Public Records
Tax History
| Year | Tax Paid | Tax Assessment Tax Assessment Total Assessment is a certain percentage of the fair market value that is determined by local assessors to be the total taxable value of land and additions on the property. | Land | Improvement |
|---|---|---|---|---|
| 2025 | $5,567 | $546,616 | $375,802 | $170,814 |
| 2024 | $5,502 | $535,899 | $368,434 | $167,465 |
| 2023 | $5,502 | $525,392 | $361,210 | $164,182 |
| 2022 | $5,418 | $515,091 | $354,128 | $160,963 |
| 2021 | $4,433 | $415,000 | $285,000 | $130,000 |
| 2020 | $4,806 | $450,000 | $310,000 | $140,000 |
| 2019 | $4,126 | $382,000 | $265,000 | $117,000 |
| 2018 | $3,938 | $362,000 | $250,000 | $112,000 |
| 2017 | $3,378 | $311,000 | $215,000 | $96,000 |
| 2016 | $3,250 | $311,000 | $215,000 | $96,000 |
| 2015 | $2,880 | $276,000 | $190,000 | $86,000 |
| 2014 | $2,557 | $250,000 | $170,000 | $80,000 |
Source: Public Records
Map
Nearby Homes
- 689 Phoebe St
- 483 Violet Ave
- 522 Higos Way
- 450 Avenida de Socios Unit 5
- 378 Avenida de Amigos
- 640 Honey Grove Ln
- 525 Grande Ave Unit D
- 571 S Oakglen Ave
- 567 S Oakglen Ave
- 565 S Oakglen Ave
- 424 Bermuda Place
- 375 Kestrel Way
- 840 S Oak Glen Ave
- 680 Hill St
- 719 W Tefft St
- 449 W Tefft St
- 449 W Tefft St Unit 22
- 449 W Tefft St Unit 23
- 449 W Tefft St Unit 13
- 270 S Tejas Place
Your Personal Tour Guide
Ask me questions while you tour the home.