Estimated Value: $386,474 - $400,000
2
Beds
2
Baths
1,261
Sq Ft
$314/Sq Ft
Est. Value
About This Home
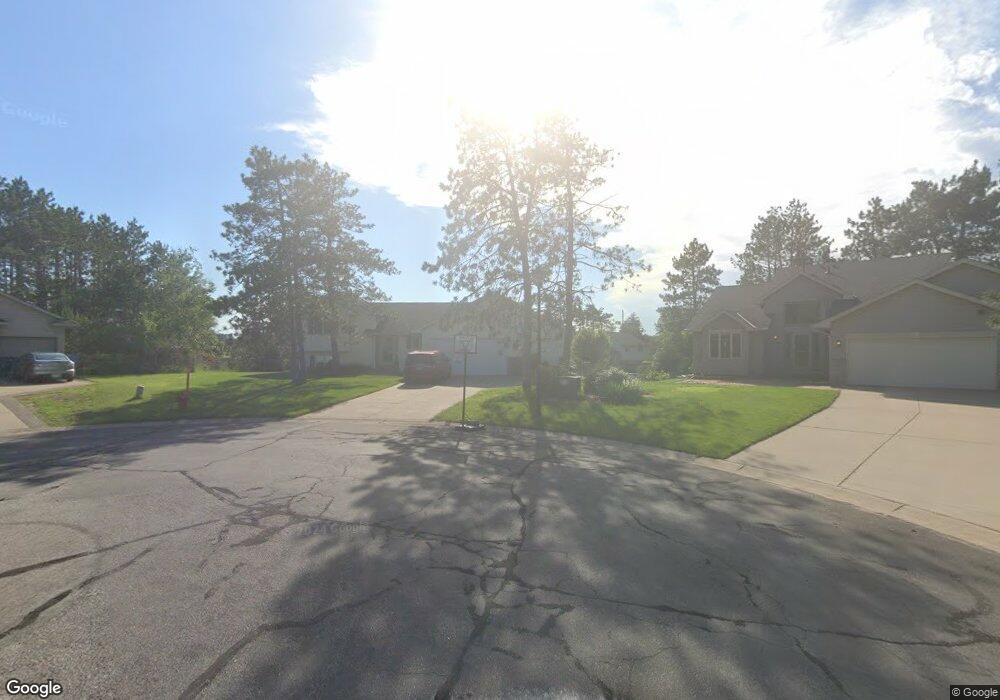
This home is located at 6590 153rd Way NW, Anoka, MN 55303 and is currently estimated at $395,619, approximately $313 per square foot. 6590 153rd Way NW is a home located in Anoka County with nearby schools including Brookside Elementary School, Anoka Middle School for the Arts - Fred Moor Campus, and Anoka Senior High School.
Ownership History
Date
Name
Owned For
Owner Type
Purchase Details
Closed on
Sep 18, 2003
Sold by
Whitford Daniel F and Whitford Beverly
Bought by
Cendant Mobility Financial Corp
Current Estimated Value
Purchase Details
Closed on
Apr 30, 2002
Sold by
Cendant Mobility Financial Corp
Bought by
Whitford Daniel F and Whitford Beverly
Purchase Details
Closed on
Apr 3, 2002
Sold by
Gile Lawrence C and Gile Annette S
Bought by
Cendant Mobility Financial Corp
Purchase Details
Closed on
Jul 2, 2001
Sold by
Henzlek Kyle L and Henzlek Mandy D
Bought by
Gile Lawrence C and Gile Annette S
Purchase Details
Closed on
Sep 2, 1998
Sold by
Drake Construction Inc
Bought by
Mjb Custom Homes Inc
Purchase Details
Closed on
Feb 13, 1998
Sold by
Alpine Partners
Bought by
Drake Construction Inc
Create a Home Valuation Report for This Property
The Home Valuation Report is an in-depth analysis detailing your home's value as well as a comparison with similar homes in the area
Home Values in the Area
Average Home Value in this Area
Purchase History
| Date | Buyer | Sale Price | Title Company |
|---|---|---|---|
| Cendant Mobility Financial Corp | $244,900 | -- | |
| Fedick Derrick | $244,900 | -- | |
| Whitford Daniel F | $208,000 | -- | |
| Cendant Mobility Financial Corp | $208,000 | -- | |
| Gile Lawrence C | $224,900 | -- | |
| Mjb Custom Homes Inc | $35,900 | -- | |
| Drake Construction Inc | $1,115,679 | -- |
Source: Public Records
Mortgage History
| Date | Status | Borrower | Loan Amount |
|---|---|---|---|
| Closed | Drake Construction Inc | -- |
Source: Public Records
Tax History Compared to Growth
Tax History
| Year | Tax Paid | Tax Assessment Tax Assessment Total Assessment is a certain percentage of the fair market value that is determined by local assessors to be the total taxable value of land and additions on the property. | Land | Improvement |
|---|---|---|---|---|
| 2025 | $3,908 | $361,800 | $88,000 | $273,800 |
| 2024 | $3,908 | $354,900 | $81,900 | $273,000 |
| 2023 | $3,647 | $357,600 | $78,000 | $279,600 |
| 2022 | $3,233 | $354,900 | $65,200 | $289,700 |
| 2021 | $3,036 | $288,100 | $54,000 | $234,100 |
| 2020 | $3,046 | $272,200 | $51,000 | $221,200 |
| 2019 | $2,895 | $265,200 | $51,000 | $214,200 |
| 2018 | $2,855 | $246,700 | $0 | $0 |
| 2017 | $2,554 | $236,200 | $0 | $0 |
| 2016 | $2,606 | $212,100 | $0 | $0 |
| 2015 | -- | $212,100 | $49,000 | $163,100 |
| 2014 | -- | $182,600 | $38,000 | $144,600 |
Source: Public Records
Map
Nearby Homes
- 15363 Radium St NW
- 15495 Sodium St NW
- 15160 Quicksilver St NW
- 7025 156th Ave NW
- 5907 151st Ln NW
- 7041 147th Ln NW
- 7080 148th Ave NW
- 5845 151st Ln NW
- 5901 151st Ln NW
- 5803 151st Ln NW
- 5817 151st Ln NW
- TBD 158th Ln NW
- 14683 Sodium St NW
- 7321 151st Ave NW
- 7411 151st Ln NW
- 6007 146th Ave NW
- 5696 154th Cove NW
- 6295 144th Ave NW
- 5658 152nd Ln NW
- 7369 147th Ln NW
- 6581 153rd Way NW
- 6608 153rd Ct NW
- 6601 153rd Ct NW
- 6610 153rd Ct NW
- 6561 153rd Way NW
- 6560 153rd Way NW
- 6540 153rd Way NW
- 6541 153rd Way NW
- 6620 153rd Ct NW
- 6621 153rd Ct NW
- 6520 153rd Way NW
- 6530 153rd Ln NW
- 6521 153rd Way NW
- 6550 153rd Ln NW
- 6640 153rd Ct NW
- 6560 153rd Ln NW
- 6641 153rd Ct NW
- 6522 153rd Ln NW
- 6500 153rd Way NW
- 6501 153rd Way NW