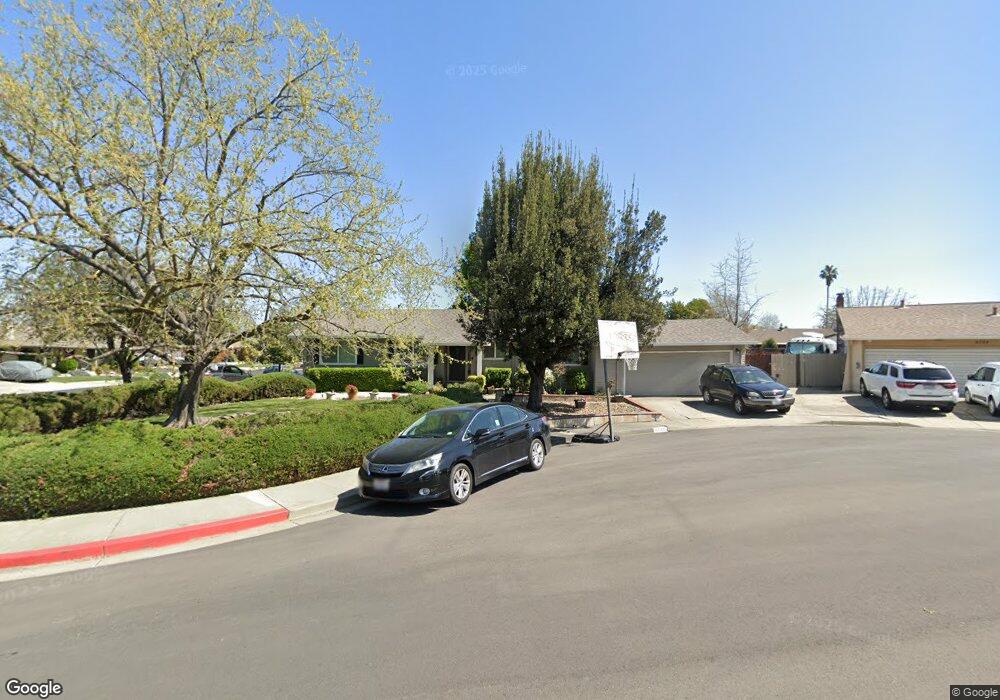
6590 Mason Ct Pleasanton, CA 94588
Stoneridge NeighborhoodEstimated Value: $1,327,000 - $1,393,000
About This Home
This home is located at 6590 Mason Ct, Pleasanton, CA 94588 and is currently estimated at $1,358,012, approximately $953 per square foot. 6590 Mason Ct is a home located in Alameda County with nearby schools including Donlon Elementary School, Thomas S. Hart Middle School, and Foothill High School.
Ownership History
We collect this data history from publicly available records. To have your information removed, we recommend requesting removal directly through your county’s website.
Purchase Details
Home Financials for this Owner
Home Financials are based on the most recent Mortgage that was taken out on this home.Home Values in the Area
Average Home Value in this Area
Purchase History
We collect this data history from publicly available records. To have your information removed, we recommend requesting removal directly through your county’s website.
| Date | Buyer | Sale Price | Title Company |
|---|---|---|---|
| $760,000 | Chicago Title Company |
Mortgage History
We collect this data history from publicly available records. To have your information removed, we recommend requesting removal directly through your county’s website.
| Date | Status | Borrower | Loan Amount |
|---|---|---|---|
| Open | $80,000 | ||
| Open | $660,000 | ||
| Closed | $608,000 | ||
| Previous Owner | $18,000 | ||
| Previous Owner | $417,000 | ||
| Previous Owner | $75,000 | ||
| Previous Owner | $307,000 | ||
| Previous Owner | $42,000 | ||
| Previous Owner | $320,000 | ||
| Previous Owner | $100,000 | ||
| Previous Owner | $52,000 | ||
| Previous Owner | $220,000 | ||
| Previous Owner | $55,000 |
Tax History
We collect this data history from publicly available records. To have your information removed, we recommend requesting removal directly through your county’s website.
| Year | Tax Paid | Tax Assessment Tax Assessment Total Assessment is a certain percentage of the fair market value that is determined by local assessors to be the total taxable value of land and additions on the property. | Land | Improvement |
|---|---|---|---|---|
| 2025 | $10,565 | $913,374 | $274,012 | $639,362 |
| 2024 | $10,565 | $895,470 | $268,641 | $626,829 |
| 2023 | $10,444 | $877,913 | $263,374 | $614,539 |
| 2022 | $9,895 | $860,700 | $258,210 | $602,490 |
| 2021 | $9,642 | $843,827 | $253,148 | $590,679 |
| 2020 | $9,519 | $835,178 | $250,553 | $584,625 |
| 2019 | $9,635 | $818,808 | $245,642 | $573,166 |
| 2018 | $9,441 | $802,757 | $240,827 | $561,930 |
| 2017 | $9,200 | $787,017 | $236,105 | $550,912 |
| 2016 | $8,495 | $771,590 | $231,477 | $540,113 |
| 2015 | $2,111 | $194,438 | $76,368 | $118,070 |
| 2014 | $2,146 | $190,629 | $74,872 | $115,757 |
Map
- 6252 Robin Ct
- 6168 Inglewood Dr
- 6225 Robin Ct
- 3929 Alma Ct
- 7403 Hillsdale Dr
- 4622 Muirwood Dr
- 7365 Tulipwood Cir
- 0 Highway 128 Hwy Unit 326001688
- 3749 Platt Ct N
- 4336 Muirwood Dr
- 3559 Glacier Ct S
- 7483 Stonedale Dr
- 5065 Muirwood Dr
- 3454 Cumberland Gap Ct
- 7747 Desertwood Ln
- 5345 Springdale Ave
- 5360 Brookside Ct
- 5344 Brookside Ct
- 7752 Fairoaks Dr
- 7331 Elmwood Cir
Ask me questions while you tour the home.