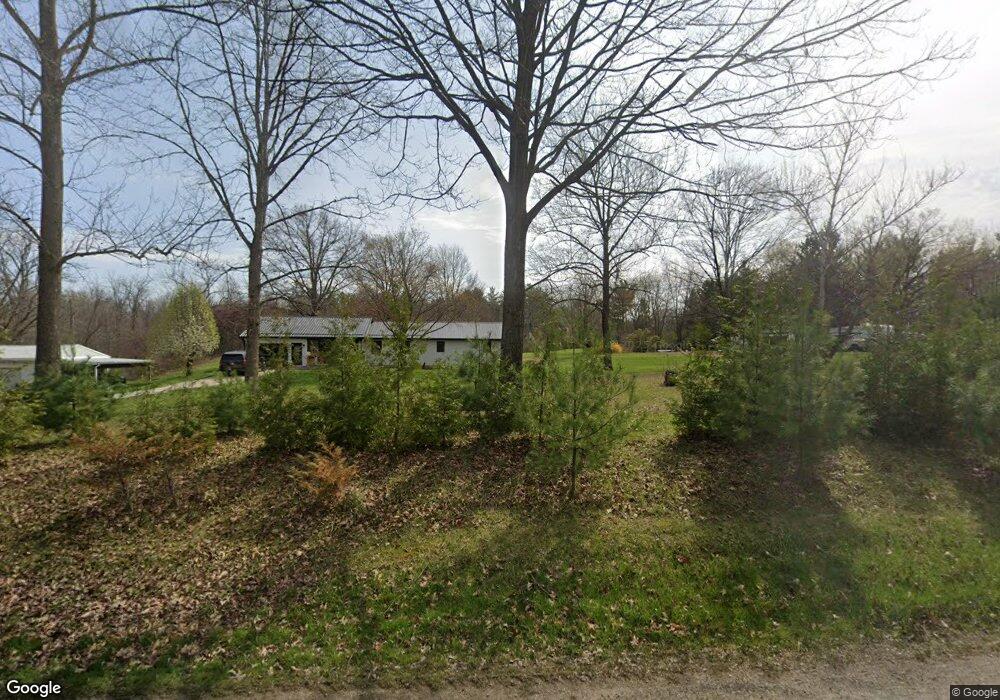
6596 N 100 E Marion, IN 46952
Estimated Value: $241,000 - $324,660
3
Beds
1
Bath
1,895
Sq Ft
$152/Sq Ft
Est. Value
About This Home
This home is located at 6596 N 100 E, Marion, IN 46952 and is currently estimated at $287,665, approximately $151 per square foot. 6596 N 100 E is a home located in Grant County.
Ownership History
Date
Name
Owned For
Owner Type
Purchase Details
Closed on
Nov 30, 2015
Sold by
Mitchell Manuel Eugene and Mitchell Randall D
Bought by
Crouch Austin J
Current Estimated Value
Home Financials for this Owner
Home Financials are based on the most recent Mortgage that was taken out on this home.
Original Mortgage
$134,704
Outstanding Balance
$104,813
Interest Rate
3.8%
Mortgage Type
New Conventional
Estimated Equity
$182,852
Purchase Details
Closed on
Sep 1, 2015
Sold by
Mitchell Steven B
Bought by
Mitchell Manuel Eugene and Mitchell Randall D
Create a Home Valuation Report for This Property
The Home Valuation Report is an in-depth analysis detailing your home's value as well as a comparison with similar homes in the area
Purchase History
| Date | Buyer | Sale Price | Title Company |
|---|---|---|---|
| Crouch Austin J | -- | None Available | |
| Mitchell Manuel Eugene | -- | None Available |
Source: Public Records
Mortgage History
| Date | Status | Borrower | Loan Amount |
|---|---|---|---|
| Open | Crouch Austin J | $134,704 |
Source: Public Records
Tax History
| Year | Tax Paid | Tax Assessment Tax Assessment Total Assessment is a certain percentage of the fair market value that is determined by local assessors to be the total taxable value of land and additions on the property. | Land | Improvement |
|---|---|---|---|---|
| 2025 | $1,594 | $230,600 | $64,800 | $165,800 |
| 2024 | $1,594 | $241,700 | $64,800 | $176,900 |
| 2023 | $1,932 | $237,200 | $64,800 | $172,400 |
| 2022 | $1,418 | $169,400 | $55,100 | $114,300 |
| 2021 | $1,263 | $149,100 | $55,100 | $94,000 |
| 2020 | $1,197 | $149,400 | $58,700 | $90,700 |
| 2019 | $1,080 | $142,200 | $58,700 | $83,500 |
| 2018 | $987 | $134,500 | $58,700 | $75,800 |
| 2017 | $890 | $128,300 | $58,700 | $69,600 |
| 2016 | $1,392 | $128,300 | $58,700 | $69,600 |
| 2014 | $858 | $130,900 | $58,700 | $72,200 |
| 2013 | $858 | $130,600 | $58,700 | $71,900 |
Source: Public Records
Map
Nearby Homes
- 5804 Red Fox Dr
- 4493 N Wabash Rd
- 933 E Bocock Rd
- 4405 N MacOmbe Dr
- 3220 N Huntington Rd
- 3105 N Huntington Rd
- 204 S Main St
- 3930 N Avalon Dr
- 1501 W Forest Ln
- 3 Mason St
- 2325 N Huntington Rd
- 3112 N Coats Rd
- 2220 N Huntington Rd
- 1906 W James Dr
- 1916 W James Dr
- 2214 N Wabash Rd
- 923 W Chapel Pike
- 1502 N Baldwin Ave
- 3576 W 505 N
- 703 E Bond Ave
Your Personal Tour Guide
Ask me questions while you tour the home.