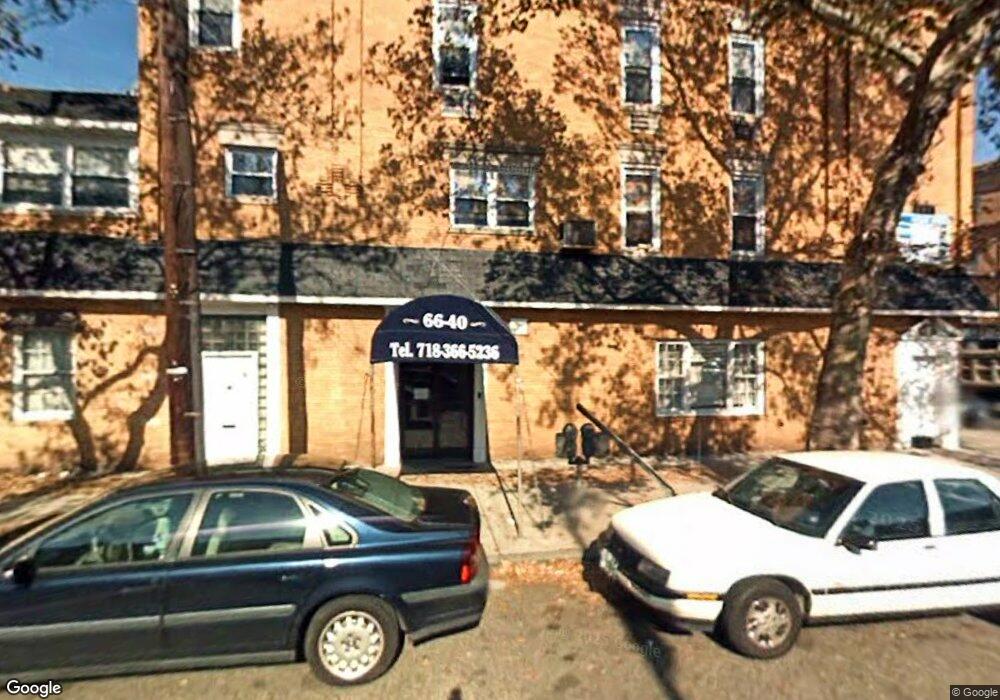
66-38 Fresh Pond Rd Unit 2nd Fl Flushing, NY 11385
Ridgewood NeighborhoodEstimated Value: $1,015,329
4
Beds
1
Bath
3,355
Sq Ft
$303/Sq Ft
Est. Value
About This Home
This home is located at 66-38 Fresh Pond Rd Unit 2nd Fl, Flushing, NY 11385 and is currently estimated at $1,015,329, approximately $302 per square foot. 66-38 Fresh Pond Rd Unit 2nd Fl is a home located in Queens County with nearby schools including P.S. 88 Seneca, I.S. 093 Ridgewood, and Grover Cleveland High School.
Ownership History
Date
Name
Owned For
Owner Type
Purchase Details
Closed on
May 15, 2024
Sold by
Novinax Realty Llc
Bought by
Fresh Pond 38 Llc
Current Estimated Value
Purchase Details
Closed on
Jun 14, 2000
Sold by
66 40 Fresh Pond Road Realty Corp
Bought by
Novinax Realty Llc
Home Financials for this Owner
Home Financials are based on the most recent Mortgage that was taken out on this home.
Original Mortgage
$425,000
Interest Rate
8.18%
Mortgage Type
Commercial
Purchase Details
Closed on
Jul 28, 1998
Sold by
Wasmund & Sorice Funeral Chapel Inc
Bought by
66 40 Fresh Pond Road Realty Corp
Home Financials for this Owner
Home Financials are based on the most recent Mortgage that was taken out on this home.
Original Mortgage
$200,000
Interest Rate
9.25%
Mortgage Type
Commercial
Create a Home Valuation Report for This Property
The Home Valuation Report is an in-depth analysis detailing your home's value as well as a comparison with similar homes in the area
Home Values in the Area
Average Home Value in this Area
Purchase History
| Date | Buyer | Sale Price | Title Company |
|---|---|---|---|
| Fresh Pond 38 Llc | $956,666 | -- | |
| Fresh Pond 38 Llc | $956,666 | -- | |
| Novinax Realty Llc | $650,000 | First American Title Ins Co | |
| Novinax Realty Llc | $650,000 | First American Title Ins Co | |
| 66 40 Fresh Pond Road Realty Corp | $500,000 | Nations Title Insurance | |
| 66 40 Fresh Pond Road Realty Corp | $500,000 | Nations Title Insurance |
Source: Public Records
Mortgage History
| Date | Status | Borrower | Loan Amount |
|---|---|---|---|
| Previous Owner | Novinax Realty Llc | $425,000 | |
| Previous Owner | 66 40 Fresh Pond Road Realty Corp | $200,000 |
Source: Public Records
Tax History Compared to Growth
Tax History
| Year | Tax Paid | Tax Assessment Tax Assessment Total Assessment is a certain percentage of the fair market value that is determined by local assessors to be the total taxable value of land and additions on the property. | Land | Improvement |
|---|---|---|---|---|
| 2025 | $9,326 | $49,218 | $12,160 | $37,058 |
| 2024 | $9,326 | $46,433 | $12,452 | $33,981 |
| 2023 | $8,798 | $43,805 | $10,481 | $33,324 |
| 2022 | $8,676 | $65,280 | $16,380 | $48,900 |
| 2021 | $9,001 | $58,140 | $16,380 | $41,760 |
| 2020 | $8,682 | $64,440 | $16,380 | $48,060 |
| 2019 | $8,094 | $67,800 | $16,380 | $51,420 |
| 2018 | $7,441 | $36,504 | $10,579 | $25,925 |
| 2017 | $7,383 | $36,216 | $11,184 | $25,032 |
| 2016 | $7,125 | $36,216 | $11,184 | $25,032 |
| 2015 | $4,121 | $34,179 | $13,198 | $20,981 |
| 2014 | $4,121 | $32,245 | $14,478 | $17,767 |
Source: Public Records
Map
Nearby Homes
- 6119 Madison St
- 61-19 Madison St
- 6157 Linden St
- 61-85 Grove St
- 6185 Grove St
- 6046 Putnam Ave
- 60-46 Putnam Ave
- 5945 Madison St
- 6334 Fresh Pond Rd Unit 4G
- 6334 Fresh Pond Rd Unit 2G
- 63-34 Fresh Pond Rd Unit 3G
- 5938 Madison St
- 65-26 Admiral Ave
- 61-25 Menahan St
- 60-14 Menahan St
- 60-12 Menahan St
- 5929 Linden St
- 5924 Putnam Ave
- 5932 Grove St
- 64-42 65th Ln
- 66-38 Fresh Pond Rd
- 66-38 Fresh Pond Rd Unit 3rd Fl
- 6638 Fresh Pond Rd
- 6640 Fresh Pond Rd
- 66-40 Fresh Pond Rd
- 6636 Fresh Pond Rd
- 6634 Fresh Pond Rd
- 66-32 Fresh Pond Rd Unit 3
- 66-32 Fresh Pond Rd
- 6632 Fresh Pond Rd
- 60-71 Woodbine St Unit 2
- 60-71 Woodbine St Unit Duplex
- 60-71 Woodbine St
- 6071 Woodbine St
- 6630 Fresh Pond Rd
- 6069 Woodbine St
- 6628 Fresh Pond Rd
- 66-28 Fresh Pond Rd
- 6626 Fresh Pond Rd
- 6065 Woodbine St