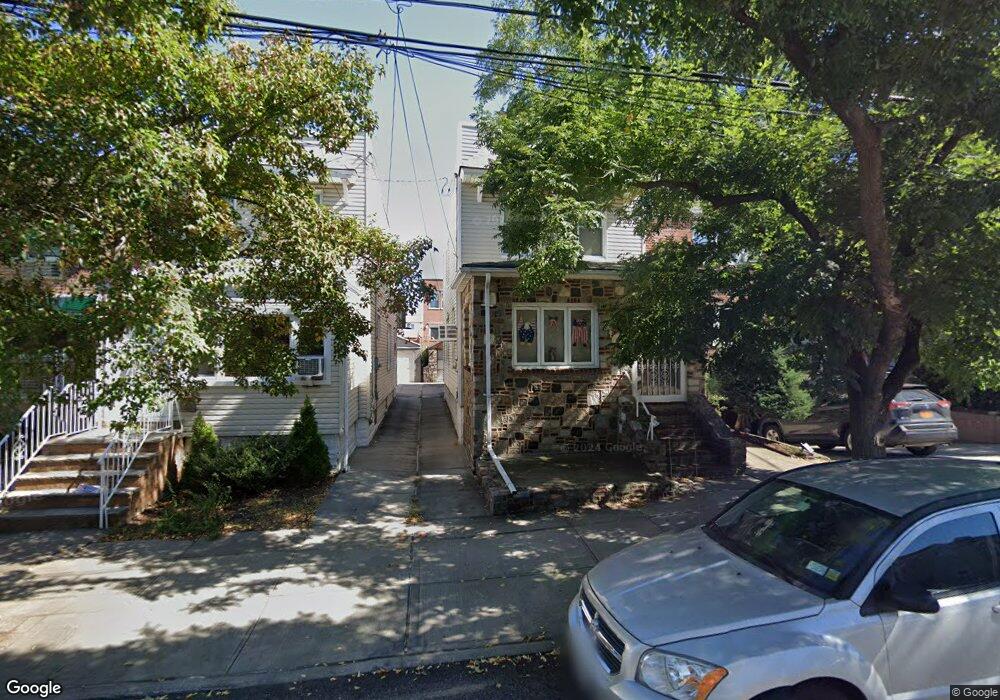
66-45 75th St Middle Village, NY 11379
Middle Village NeighborhoodEstimated Value: $839,000 - $922,000
3
Beds
2
Baths
1,312
Sq Ft
$668/Sq Ft
Est. Value
About This Home
This home is located at 66-45 75th St, Middle Village, NY 11379 and is currently estimated at $875,988, approximately $667 per square foot. 66-45 75th St is a home located in Queens County with nearby schools including P.S. 87 - Middle Village, Queens Metropolitan High School, and Middle Village Preparatory Charter School.
Ownership History
Date
Name
Owned For
Owner Type
Purchase Details
Closed on
May 11, 2017
Sold by
Ruth Karen C and Zajac Karen C
Bought by
Chai Kevin Hsiao Chun
Current Estimated Value
Home Financials for this Owner
Home Financials are based on the most recent Mortgage that was taken out on this home.
Original Mortgage
$250,000
Outstanding Balance
$207,792
Interest Rate
4.08%
Mortgage Type
Purchase Money Mortgage
Estimated Equity
$668,196
Purchase Details
Closed on
Feb 5, 2013
Sold by
70-11 Maspeth Llc
Bought by
Zajac Karen C
Home Financials for this Owner
Home Financials are based on the most recent Mortgage that was taken out on this home.
Original Mortgage
$250,000
Interest Rate
3.43%
Mortgage Type
New Conventional
Purchase Details
Closed on
May 24, 2012
Sold by
Centola Anthony G
Bought by
70-11 Maspeth Llc
Purchase Details
Closed on
May 20, 2002
Sold by
Centola Rita
Bought by
Declaration Rita Centola and Centola Anthony G
Create a Home Valuation Report for This Property
The Home Valuation Report is an in-depth analysis detailing your home's value as well as a comparison with similar homes in the area
Home Values in the Area
Average Home Value in this Area
Purchase History
| Date | Buyer | Sale Price | Title Company |
|---|---|---|---|
| Chai Kevin Hsiao Chun | $650,000 | -- | |
| Zajac Karen C | $500,000 | -- | |
| 70-11 Maspeth Llc | $367,500 | -- | |
| Declaration Rita Centola | -- | -- |
Source: Public Records
Mortgage History
| Date | Status | Borrower | Loan Amount |
|---|---|---|---|
| Open | Chai Kevin Hsiao Chun | $250,000 | |
| Previous Owner | Zajac Karen C | $250,000 |
Source: Public Records
Tax History Compared to Growth
Tax History
| Year | Tax Paid | Tax Assessment Tax Assessment Total Assessment is a certain percentage of the fair market value that is determined by local assessors to be the total taxable value of land and additions on the property. | Land | Improvement |
|---|---|---|---|---|
| 2025 | $6,131 | $31,458 | $10,956 | $20,502 |
| 2024 | $6,131 | $30,524 | $10,137 | $20,387 |
| 2023 | $5,785 | $28,805 | $8,833 | $19,972 |
| 2022 | $5,493 | $45,300 | $16,320 | $28,980 |
| 2021 | $5,519 | $45,900 | $16,320 | $29,580 |
| 2020 | $5,549 | $43,500 | $16,320 | $27,180 |
| 2019 | $5,321 | $45,600 | $16,320 | $29,280 |
| 2018 | $4,893 | $24,004 | $10,138 | $13,866 |
| 2017 | $4,374 | $22,929 | $10,059 | $12,870 |
| 2016 | $4,059 | $22,929 | $10,059 | $12,870 |
| 2015 | $2,609 | $21,846 | $11,454 | $10,392 |
| 2014 | $2,609 | $21,198 | $12,959 | $8,239 |
Source: Public Records
Map
Nearby Homes
- 6616 75th St
- 64-28 75th St
- 75-34 Furmanville Ave
- 66-13 73rd Place
- 75-27 Furmanville Ave
- 66-48 73rd Place
- 6509 77th Place
- 6368 77th St
- 73-08 Juniper Valley Rd
- 75-33 67th Rd
- 72-35 Metropolitan Ave Unit BD
- 7252 Metropolitan Ave Unit 3C
- 63-61 77th St
- 6631 Pleasantview St
- 6547 79th St
- 63-33 75th St
- 63-37 76th St
- 6404 78th St
- 64-13 72nd St
- 71-31 66th Rd
- 6641 75th St
- 6639 75th St
- 6637 75th St
- 66-35 75th St
- 66-43 75th St
- 6643A 75th St
- 6643 75th St
- 6643 75th St
- 6635 75th St
- 66-37 75th St
- 6643A 75th St
- 6645 75th St
- 6633 75th St
- 6647 75th St
- 66-38 75 St Unit 2
- 66-38 75 St Unit 2 flr
- 66-38 75th St
- 66-38 75th St Unit 1
- 66-38 75th St Unit 2
- 66-38 75th St Unit 2 flr