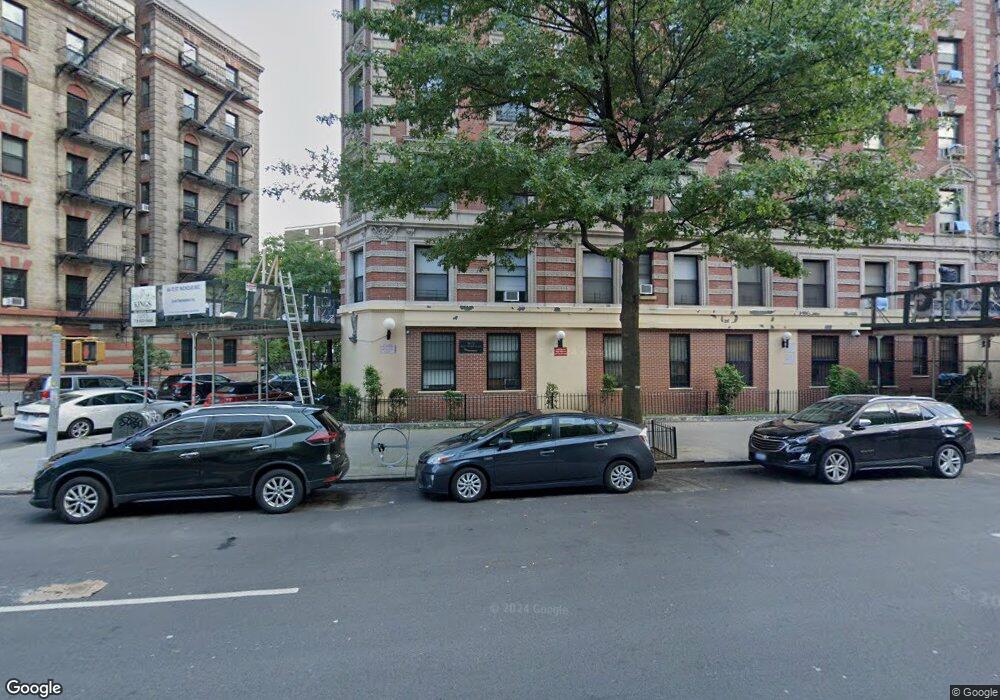
66-72 Saint Nicholas Ave Unit 2F New York, NY 10026
Central Harlem NeighborhoodEstimated Value: $264,000 - $574,000
--
Bed
--
Bath
773
Sq Ft
$549/Sq Ft
Est. Value
About This Home
This home is located at 66-72 Saint Nicholas Ave Unit 2F, New York, NY 10026 and is currently estimated at $424,195, approximately $548 per square foot. 66-72 Saint Nicholas Ave Unit 2F is a home located in New York County with nearby schools including Locke School for Arts and Engineering, P.S. 208 Alain L Locke, and Harlem Link Charter School.
Ownership History
Date
Name
Owned For
Owner Type
Purchase Details
Closed on
Jul 19, 2023
Sold by
Steven B. Shapiro
Bought by
Satisfied Arrears Condominium Made Whole
Current Estimated Value
Purchase Details
Closed on
Nov 17, 2005
Sold by
Robinson Edriss D
Bought by
Smith Adrienne
Home Financials for this Owner
Home Financials are based on the most recent Mortgage that was taken out on this home.
Original Mortgage
$90,000
Interest Rate
6.14%
Purchase Details
Closed on
Oct 31, 2000
Sold by
Madrey Annette
Bought by
Robinson Edriss D
Home Financials for this Owner
Home Financials are based on the most recent Mortgage that was taken out on this home.
Original Mortgage
$88,000
Interest Rate
7.78%
Mortgage Type
Purchase Money Mortgage
Create a Home Valuation Report for This Property
The Home Valuation Report is an in-depth analysis detailing your home's value as well as a comparison with similar homes in the area
Home Values in the Area
Average Home Value in this Area
Purchase History
| Date | Buyer | Sale Price | Title Company |
|---|---|---|---|
| Satisfied Arrears Condominium Made Whole | $79,330 | -- | |
| Smith Adrienne | $450,000 | -- | |
| Smith Adrienne | $450,000 | -- | |
| Robinson Edriss D | $110,000 | -- | |
| Robinson Edriss D | $110,000 | -- |
Source: Public Records
Mortgage History
| Date | Status | Borrower | Loan Amount |
|---|---|---|---|
| Previous Owner | Smith Adrienne | $90,000 | |
| Previous Owner | Smith Adrienne | $360,000 | |
| Previous Owner | Robinson Edriss D | $88,000 |
Source: Public Records
Tax History Compared to Growth
Tax History
| Year | Tax Paid | Tax Assessment Tax Assessment Total Assessment is a certain percentage of the fair market value that is determined by local assessors to be the total taxable value of land and additions on the property. | Land | Improvement |
|---|---|---|---|---|
| 2025 | $2,997 | $36,017 | $4,201 | $31,816 |
| 2024 | $2,997 | $35,527 | $4,201 | $31,326 |
| 2023 | $2,126 | $34,669 | $4,201 | $30,468 |
| 2022 | $1,186 | $31,072 | $4,201 | $26,871 |
| 2021 | $534 | $33,183 | $4,201 | $28,982 |
| 2020 | $543 | $37,767 | $4,201 | $33,566 |
| 2019 | $549 | $33,539 | $4,201 | $29,338 |
| 2018 | $553 | $32,369 | $4,201 | $28,168 |
| 2017 | $522 | $31,815 | $4,202 | $27,613 |
| 2016 | $494 | $30,856 | $4,202 | $26,654 |
| 2015 | $303 | $29,742 | $4,201 | $25,541 |
| 2014 | $303 | $28,007 | $4,201 | $23,806 |
Source: Public Records
Map
Nearby Homes
- 66-72 St Nicholas Ave Unit 3 G
- 66 St Nicholas Ave Unit 5 E
- 80 St Nicholas Ave Unit 1E
- 108 W 114th St Unit 2B
- 111 W 113th St Unit 3-B
- 111 W 113th St Unit 4-B
- 92 St Nicholas Ave Unit 5-G
- 127 W 112th St Unit 6A
- 135 W 115th St Unit 1E
- 1845 Adam Clayton Powell Jr Blvd Unit 5c
- 100 St Nicholas Ave Unit 7 E
- 1878 Adam C Powell Blvd Unit 41
- 1878 Adam Clayton Powell Jr Blvd Unit 52
- 106 W 116th St Unit 2A
- 106 W 116th St Unit 9A
- 106 W 116th St Unit 5B
- 106 W 116th St Unit 10A
- 106 W 116th St Unit 10B
- 106 W 116th St Unit PH1B
- 1864 Adam Clayton Powell Jr Blvd Unit 61
- 66-72 St Nicholas Ave Unit 7C
- 66-72 St Nicholas Ave Unit 5 F
- 66-72 St Nicholas Ave Unit 1 C
- 66-72 St Nicholas Ave Unit 5 E
- 66-72 St Nicholas Ave Unit 4 B
- 66-72 St Nicholas Ave Unit 5-G
- 66-72 St Nicholas Ave Unit 5-A
- 66-72 St Nicholas Ave Unit 7 H
- 66-72 St Nicholas Ave Unit 4 F
- 66-72 St Nicholas Ave Unit 2 F
- 66-72 St Nicholas Ave Unit 1 H
- 66-72 St Nicholas Ave Unit 2 C
- 66-72 St Nicholas Ave Unit 6 G
- 66-72 St Nicholas Ave Unit 1 G
- 66-72 St Nicholas Ave Unit 6 F
- 66-72 St Nicholas Ave Unit 7 F
- 66-72 Saint Nicholas Ave Unit 7F
- 66-72 Saint Nicholas Ave Unit 3C
- 66-72 Saint Nicholas Ave Unit 5A