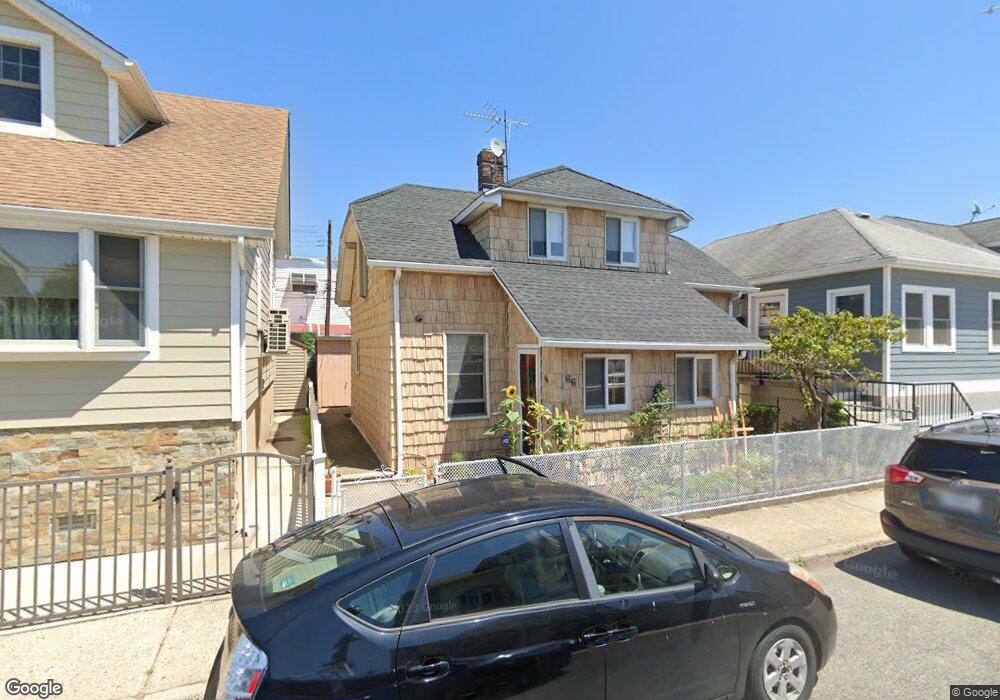
66 Aster Ct Brooklyn, NY 11229
Gerritsen Beach NeighborhoodEstimated Value: $603,000 - $806,000
Studio
--
Bath
1,552
Sq Ft
$435/Sq Ft
Est. Value
About This Home
This home is located at 66 Aster Ct, Brooklyn, NY 11229 and is currently estimated at $675,082, approximately $434 per square foot. 66 Aster Ct is a home located in Kings County with nearby schools including P.S. 277 Gerritsen Beach, J.H.S. 278 Marine Park, and New Visions Charter High School for Advanced Math/ Science.
Ownership History
Date
Name
Owned For
Owner Type
Purchase Details
Closed on
Jun 30, 2016
Sold by
Gelb Lee
Bought by
Chen Xinen and Zhang Yu Xiang
Current Estimated Value
Purchase Details
Closed on
Jan 27, 2011
Sold by
Sullivan Jane
Bought by
Gelb Lee and Gurrieri Jessica
Home Financials for this Owner
Home Financials are based on the most recent Mortgage that was taken out on this home.
Original Mortgage
$370,367
Interest Rate
4.88%
Mortgage Type
Purchase Money Mortgage
Create a Home Valuation Report for This Property
The Home Valuation Report is an in-depth analysis detailing your home's value as well as a comparison with similar homes in the area
Home Values in the Area
Average Home Value in this Area
Purchase History
| Date | Buyer | Sale Price | Title Company |
|---|---|---|---|
| Chen Xinen | $420,000 | -- | |
| Gelb Lee | $380,000 | -- |
Source: Public Records
Mortgage History
| Date | Status | Borrower | Loan Amount |
|---|---|---|---|
| Previous Owner | Gelb Lee | $370,367 |
Source: Public Records
Tax History
| Year | Tax Paid | Tax Assessment Tax Assessment Total Assessment is a certain percentage of the fair market value that is determined by local assessors to be the total taxable value of land and additions on the property. | Land | Improvement |
|---|---|---|---|---|
| 2025 | $4,576 | $32,280 | $8,220 | $24,060 |
| 2024 | $4,576 | $35,400 | $8,220 | $27,180 |
| 2023 | $4,366 | $42,180 | $8,220 | $33,960 |
| 2022 | $4,119 | $37,680 | $8,220 | $29,460 |
| 2021 | $4,137 | $34,620 | $8,220 | $26,400 |
| 2020 | $4,183 | $34,740 | $8,220 | $26,520 |
| 2019 | $3,972 | $30,900 | $8,220 | $22,680 |
| 2018 | $3,652 | $17,914 | $6,894 | $11,020 |
| 2017 | $3,505 | $17,196 | $5,530 | $11,666 |
| 2016 | $3,294 | $16,478 | $4,506 | $11,972 |
| 2015 | $1,957 | $16,470 | $6,748 | $9,722 |
| 2014 | $1,957 | $15,823 | $6,483 | $9,340 |
Source: Public Records
Map
Nearby Homes
- 55 Aster Ct
- 57 Dictum Ct
- 53 Dictum Ct
- 37 Celeste Ct
- 103 Aster Ct
- 43 Dictum Ct
- 103 Fane Ct
- 27 Aster Ct
- 108 Celeste Ct
- 108 Garland Ct
- 25 Celeste Ct
- 2492 Gerritsen Ave
- 2455 Stuart St
- 37-41 Joval Ct
- 3168 Whitney Ave
- 3172 Whitney Ave
- 87 Bartlett Place
- 48 Gotham Ave
- 3171 Whitney Ave Unit 1B
- 3171 Whitney Ave Unit 3F
Your Personal Tour Guide
Ask me questions while you tour the home.