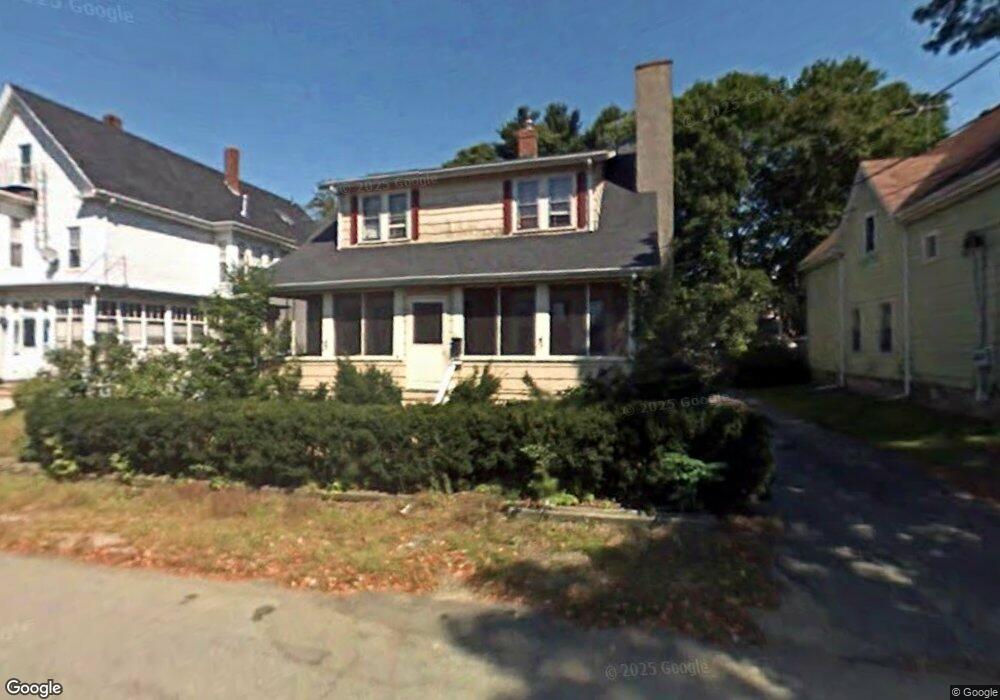
66 Auburn St Brockton, MA 02302
Campello NeighborhoodEstimated Value: $479,000 - $509,273
3
Beds
1
Bath
1,560
Sq Ft
$316/Sq Ft
Est. Value
About This Home
This home is located at 66 Auburn St, Brockton, MA 02302 and is currently estimated at $493,568, approximately $316 per square foot. 66 Auburn St is a home located in Plymouth County with nearby schools including Davis K-8 School, John F. Kennedy Elementary School, and South Middle School.
Ownership History
Date
Name
Owned For
Owner Type
Purchase Details
Closed on
Feb 20, 2009
Sold by
Bates Michael and Bates Lillian E
Bought by
Bates Michael
Current Estimated Value
Home Financials for this Owner
Home Financials are based on the most recent Mortgage that was taken out on this home.
Original Mortgage
$140,000
Outstanding Balance
$88,307
Interest Rate
5.06%
Mortgage Type
Purchase Money Mortgage
Estimated Equity
$405,261
Purchase Details
Closed on
Jul 30, 1999
Sold by
Thomas Susan M and Thomas Alan E
Bought by
Bates Michael and Bates Lillian E
Home Financials for this Owner
Home Financials are based on the most recent Mortgage that was taken out on this home.
Original Mortgage
$132,600
Interest Rate
7.61%
Mortgage Type
Purchase Money Mortgage
Create a Home Valuation Report for This Property
The Home Valuation Report is an in-depth analysis detailing your home's value as well as a comparison with similar homes in the area
Home Values in the Area
Average Home Value in this Area
Purchase History
| Date | Buyer | Sale Price | Title Company |
|---|---|---|---|
| Bates Michael | -- | -- | |
| Bates Michael | $130,000 | -- |
Source: Public Records
Mortgage History
| Date | Status | Borrower | Loan Amount |
|---|---|---|---|
| Open | Bates Michael | $140,000 | |
| Previous Owner | Bates Michael | $160,783 | |
| Previous Owner | Bates Michael | $132,600 |
Source: Public Records
Tax History Compared to Growth
Tax History
| Year | Tax Paid | Tax Assessment Tax Assessment Total Assessment is a certain percentage of the fair market value that is determined by local assessors to be the total taxable value of land and additions on the property. | Land | Improvement |
|---|---|---|---|---|
| 2025 | $5,115 | $422,400 | $138,700 | $283,700 |
| 2024 | $4,892 | $407,000 | $138,700 | $268,300 |
| 2023 | $4,983 | $383,900 | $103,300 | $280,600 |
| 2022 | $4,420 | $316,400 | $93,800 | $222,600 |
| 2021 | $4,691 | $323,500 | $77,700 | $245,800 |
| 2020 | $4,100 | $270,600 | $73,000 | $197,600 |
| 2019 | $3,818 | $245,700 | $71,100 | $174,600 |
| 2018 | $3,625 | $225,700 | $71,100 | $154,600 |
| 2017 | $3,505 | $217,700 | $71,100 | $146,600 |
| 2016 | $2,981 | $171,700 | $68,800 | $102,900 |
| 2015 | $2,964 | $163,300 | $68,800 | $94,500 |
| 2014 | $3,086 | $170,200 | $68,800 | $101,400 |
Source: Public Records
Map
Nearby Homes
- 163 S Leyden St
- 223 Clinton St Unit 10
- 223 Clinton St Unit 3
- 44 Baker St
- 112 Hillside Ave
- 34 Carl Ave
- 54 Ferris Ave
- 28 Wallace St
- 103 Clinton St
- 12 Paulin Ave
- 65 Tremont St
- 35 Longworth Ave Unit 17
- 115 Market St
- 70 Carlisle St
- 15 Longworth Ave Unit 231
- 229 Sinclair Rd
- 221 Sinclair Rd
- 977 Warren Ave
- 936 Warren Ave
- 265 Summer St