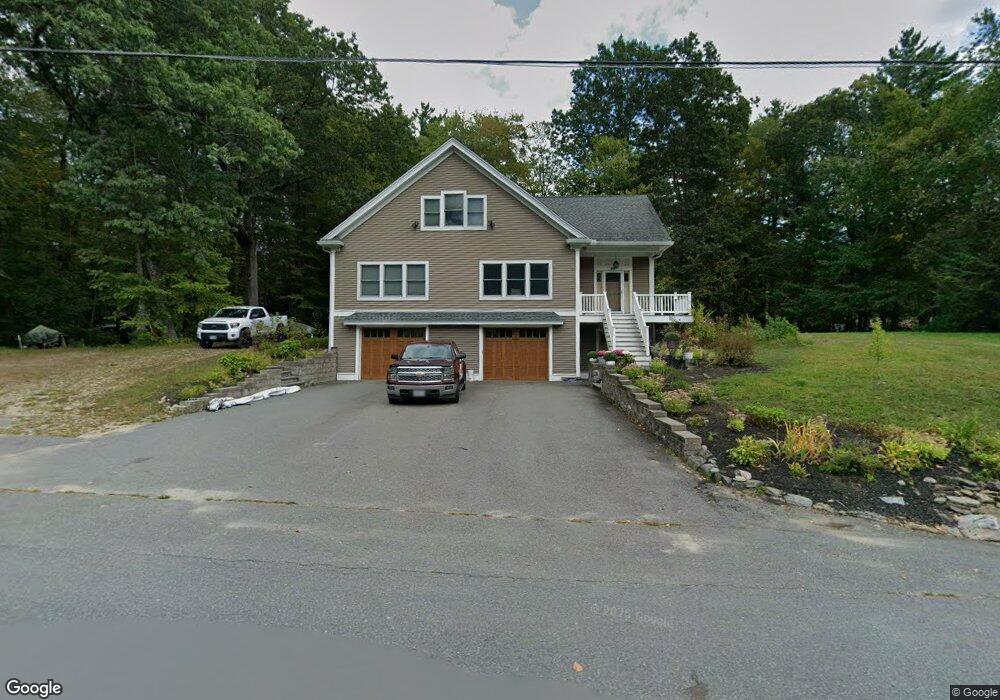
66 Beachview Rd Lunenburg, MA 01462
Estimated Value: $482,000 - $771,000
2
Beds
2
Baths
2,298
Sq Ft
$290/Sq Ft
Est. Value
About This Home
This home is located at 66 Beachview Rd, Lunenburg, MA 01462 and is currently estimated at $665,784, approximately $289 per square foot. 66 Beachview Rd is a home located in Worcester County with nearby schools including Lunenburg Primary School and Lunenburg High School.
Ownership History
Date
Name
Owned For
Owner Type
Purchase Details
Closed on
Oct 10, 2003
Sold by
Mascitti Mark R
Bought by
Albert Christopher J and Albert Tammy L
Current Estimated Value
Home Financials for this Owner
Home Financials are based on the most recent Mortgage that was taken out on this home.
Original Mortgage
$144,000
Interest Rate
6.35%
Mortgage Type
Purchase Money Mortgage
Purchase Details
Closed on
Jul 8, 1997
Sold by
Denault Aime R and Denault Ella R
Bought by
Mascitti Mark R
Home Financials for this Owner
Home Financials are based on the most recent Mortgage that was taken out on this home.
Original Mortgage
$76,400
Interest Rate
7.86%
Mortgage Type
Purchase Money Mortgage
Create a Home Valuation Report for This Property
The Home Valuation Report is an in-depth analysis detailing your home's value as well as a comparison with similar homes in the area
Home Values in the Area
Average Home Value in this Area
Purchase History
| Date | Buyer | Sale Price | Title Company |
|---|---|---|---|
| Albert Christopher J | $180,000 | -- | |
| Mascitti Mark R | $80,500 | -- |
Source: Public Records
Mortgage History
| Date | Status | Borrower | Loan Amount |
|---|---|---|---|
| Open | Mascitti Mark R | $240,000 | |
| Closed | Albert Christopher J | $144,000 | |
| Previous Owner | Mascitti Mark R | $76,400 | |
| Previous Owner | Mascitti Mark R | $68,000 |
Source: Public Records
Tax History Compared to Growth
Tax History
| Year | Tax Paid | Tax Assessment Tax Assessment Total Assessment is a certain percentage of the fair market value that is determined by local assessors to be the total taxable value of land and additions on the property. | Land | Improvement |
|---|---|---|---|---|
| 2025 | $9,195 | $640,300 | $118,800 | $521,500 |
| 2024 | $8,863 | $628,600 | $112,100 | $516,500 |
| 2023 | $8,689 | $594,300 | $100,800 | $493,500 |
| 2022 | $7,830 | $455,500 | $84,100 | $371,400 |
| 2020 | $7,895 | $435,700 | $84,100 | $351,600 |
| 2019 | $7,663 | $410,200 | $77,600 | $332,600 |
| 2018 | $7,336 | $372,400 | $80,800 | $291,600 |
| 2017 | $6,717 | $336,200 | $68,900 | $267,300 |
| 2016 | $6,391 | $325,900 | $69,500 | $256,400 |
| 2015 | $4,324 | $236,000 | $66,400 | $169,600 |
Source: Public Records
Map
Nearby Homes
- 55 Beachview Rd
- 167 S Row Rd
- 91 Valley Rd
- 00 Tyler Rd
- 7 Hickory Ln
- 5 Chestnut Dr
- 64 Maplewood Dr
- 2 Tamarack Ln
- 0 Tyler Rd Unit 72560808
- 691 Chase Rd
- 1790 Massachusetts Ave Unit 25
- 1790 Mass Ave Unit 3
- 1790 Massachusetts Ave Unit 22
- 63 Holman St
- Lot 10 Christian Cir
- 28 Beech St
- 18 Beech St
- 319 Highland St
- 166 Elmwood Rd
- 64 Chestnut St