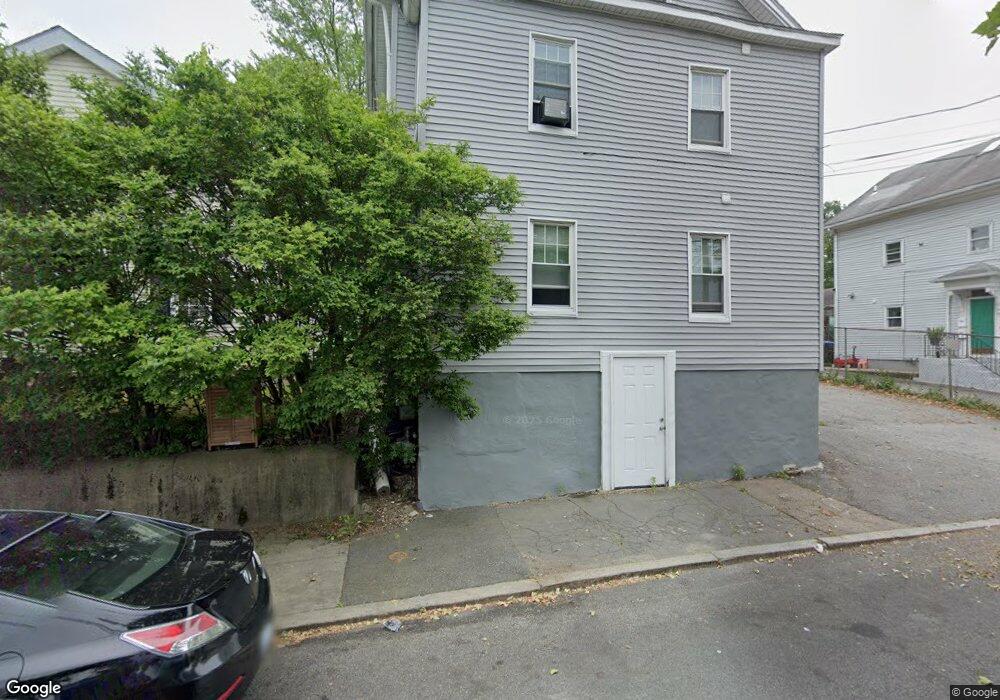
66 Borinquen St Providence, RI 02905
Upper South Providence NeighborhoodEstimated Value: $485,000 - $564,000
5
Beds
3
Baths
2,452
Sq Ft
$217/Sq Ft
Est. Value
About This Home
This home is located at 66 Borinquen St, Providence, RI 02905 and is currently estimated at $532,333, approximately $217 per square foot. 66 Borinquen St is a home with nearby schools including SouthSide Elementary Charter, The Hope Academy, and Bishop Mcvinney Elementary School.
Ownership History
Date
Name
Owned For
Owner Type
Purchase Details
Closed on
May 24, 2018
Sold by
Brennan Joseph P
Bought by
Southern Lending & Dev
Current Estimated Value
Home Financials for this Owner
Home Financials are based on the most recent Mortgage that was taken out on this home.
Original Mortgage
$375,000
Outstanding Balance
$322,887
Interest Rate
4.4%
Mortgage Type
Unknown
Estimated Equity
$209,446
Purchase Details
Closed on
Aug 27, 2012
Sold by
Candon Robert
Bought by
Brennan Joseph
Create a Home Valuation Report for This Property
The Home Valuation Report is an in-depth analysis detailing your home's value as well as a comparison with similar homes in the area
Home Values in the Area
Average Home Value in this Area
Purchase History
| Date | Buyer | Sale Price | Title Company |
|---|---|---|---|
| Southern Lending & Dev | -- | -- | |
| Brennan Joseph | $20,000 | -- | |
| Candon Robert | $13,000 | -- |
Source: Public Records
Mortgage History
| Date | Status | Borrower | Loan Amount |
|---|---|---|---|
| Open | Southern Lending & Dev | $375,000 |
Source: Public Records
Tax History
| Year | Tax Paid | Tax Assessment Tax Assessment Total Assessment is a certain percentage of the fair market value that is determined by local assessors to be the total taxable value of land and additions on the property. | Land | Improvement |
|---|---|---|---|---|
| 2025 | $6,294 | $449,600 | $101,300 | $348,300 |
| 2024 | $5,347 | $291,400 | $56,800 | $234,600 |
| 2023 | $5,347 | $291,400 | $56,800 | $234,600 |
| 2022 | $5,187 | $291,400 | $56,800 | $234,600 |
| 2021 | $4,168 | $169,700 | $25,800 | $143,900 |
| 2020 | $4,168 | $169,700 | $25,800 | $143,900 |
| 2019 | $4,168 | $169,700 | $25,800 | $143,900 |
| 2018 | $3,378 | $105,700 | $23,400 | $82,300 |
| 2017 | $3,378 | $105,700 | $23,400 | $82,300 |
| 2016 | $3,378 | $105,700 | $23,400 | $82,300 |
| 2015 | $2,565 | $77,500 | $23,400 | $54,100 |
| 2014 | $2,616 | $77,500 | $23,400 | $54,100 |
| 2013 | $1,823 | $54,000 | $23,400 | $30,600 |
Source: Public Records
Map
Nearby Homes
- 754 Eddy St Unit 3B
- 36 Eudora St
- 67 Trask St
- 24 Reynolds Ave
- 298 Swan St
- 272 Sayles St
- 462 Prairie Ave
- 14 Burnside St
- 138 Oxford St
- 3 Mount Vernon St
- 186 Oxford St
- 344 Blackstone St
- 15-17 278 Emmett Beacon and Point
- 155 Burnside St
- 182 Ocean St
- 171 Reynolds Ave
- 87 Gallup St
- 394 Blackstone St
- 296 Potters Ave
- 71 Colfax St
Your Personal Tour Guide
Ask me questions while you tour the home.