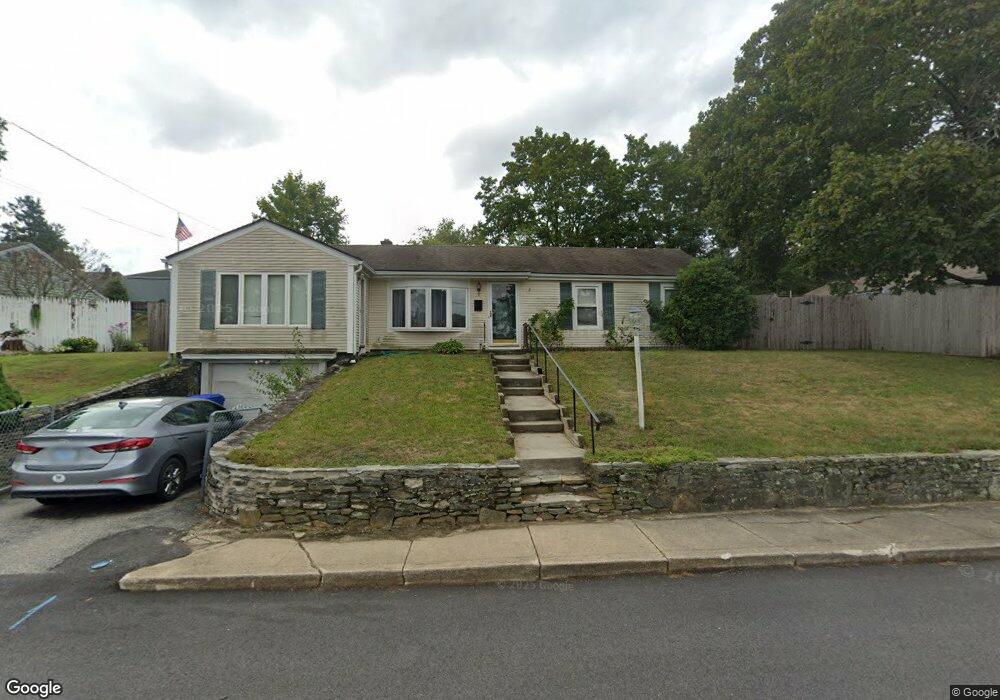
66 Carlson Cir West Warwick, RI 02893
Centreville NeighborhoodEstimated Value: $396,000 - $420,000
3
Beds
2
Baths
1,600
Sq Ft
$255/Sq Ft
Est. Value
About This Home
This home is located at 66 Carlson Cir, West Warwick, RI 02893 and is currently estimated at $408,776, approximately $255 per square foot. 66 Carlson Cir is a home located in Kent County with nearby schools including West Warwick High School.
Ownership History
Date
Name
Owned For
Owner Type
Purchase Details
Closed on
Aug 28, 2015
Sold by
Needham Hilda
Bought by
Needham Hilda and Hirons Philip G
Current Estimated Value
Home Financials for this Owner
Home Financials are based on the most recent Mortgage that was taken out on this home.
Original Mortgage
$95,000
Outstanding Balance
$38,305
Interest Rate
4.09%
Estimated Equity
$370,471
Purchase Details
Closed on
Jan 29, 2001
Sold by
Smith Beverly A
Bought by
Needham Hilda
Home Financials for this Owner
Home Financials are based on the most recent Mortgage that was taken out on this home.
Original Mortgage
$86,400
Interest Rate
7.39%
Create a Home Valuation Report for This Property
The Home Valuation Report is an in-depth analysis detailing your home's value as well as a comparison with similar homes in the area
Home Values in the Area
Average Home Value in this Area
Purchase History
| Date | Buyer | Sale Price | Title Company |
|---|---|---|---|
| Needham Hilda | -- | -- | |
| Needham Hilda | $96,000 | -- |
Source: Public Records
Mortgage History
| Date | Status | Borrower | Loan Amount |
|---|---|---|---|
| Open | Needham Hilda | $95,000 | |
| Previous Owner | Needham Hilda | $160,200 | |
| Previous Owner | Needham Hilda | $128,000 | |
| Previous Owner | Needham Hilda | $86,400 |
Source: Public Records
Tax History Compared to Growth
Tax History
| Year | Tax Paid | Tax Assessment Tax Assessment Total Assessment is a certain percentage of the fair market value that is determined by local assessors to be the total taxable value of land and additions on the property. | Land | Improvement |
|---|---|---|---|---|
| 2025 | $5,270 | $368,800 | $111,500 | $257,300 |
| 2024 | $4,951 | $264,900 | $74,600 | $190,300 |
| 2023 | $4,853 | $264,900 | $74,600 | $190,300 |
| 2022 | $4,779 | $264,900 | $74,600 | $190,300 |
| 2021 | $4,570 | $198,700 | $62,200 | $136,500 |
| 2020 | $4,570 | $198,700 | $62,200 | $136,500 |
| 2019 | $5,826 | $198,700 | $62,200 | $136,500 |
| 2018 | $3,896 | $157,300 | $64,700 | $92,600 |
| 2017 | $4,139 | $157,300 | $64,700 | $92,600 |
| 2016 | $4,065 | $157,300 | $64,700 | $92,600 |
| 2015 | $4,013 | $154,600 | $64,700 | $89,900 |
| 2014 | $3,925 | $154,600 | $64,700 | $89,900 |
Source: Public Records
Map
Nearby Homes
- 34 Buckley Ave
- 125 Revere Ave
- 3 June Ct
- 177 Cowesett Ave
- 25 School St
- 13 School St
- 2 Teresa Ann Crossing
- 6 Teresa Ann Crossing
- 8 Teresa Ann Crossing
- 4 Teresa Ann Crossing
- 16 Ontario St
- 64 Lockwood St
- 18 Jacques St
- 5 W Glen Ln
- 25 Fawn Ln
- 40 E Greenwich Ave
- 52 Glen Dr
- 54 Arthur St
- 34 Silverwood Ln
- 3 Leona Ct