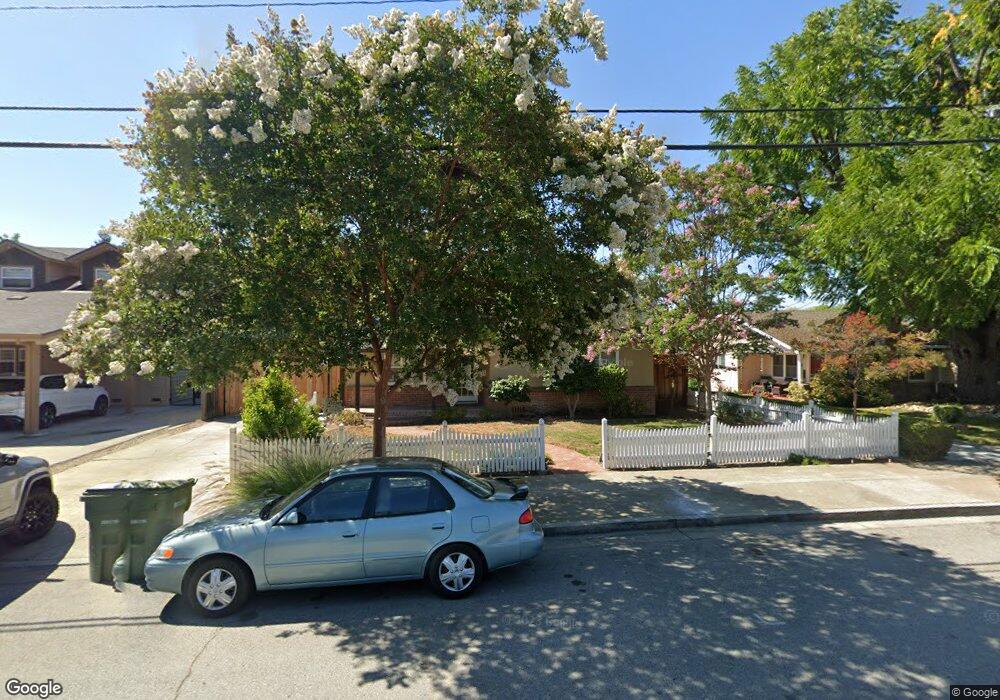
66 Cherry Ln Campbell, CA 95008
Estimated Value: $2,037,000 - $2,360,000
3
Beds
2
Baths
1,186
Sq Ft
$1,809/Sq Ft
Est. Value
About This Home
This home is located at 66 Cherry Ln, Campbell, CA 95008 and is currently estimated at $2,145,666, approximately $1,809 per square foot. 66 Cherry Ln is a home located in Santa Clara County with nearby schools including Westmont High School, Campbell School of Innovation, and Capri Elementary.
Ownership History
Date
Name
Owned For
Owner Type
Purchase Details
Closed on
May 23, 2018
Sold by
Lorenz Howard K and Lorenz Joyce
Bought by
Lorenz Howard K and Lorenz Joyce
Current Estimated Value
Purchase Details
Closed on
May 18, 2009
Sold by
Lorenz Howard K and Lorenz Joyce
Bought by
Lorenz Howard K and Lorenz Joyce
Home Financials for this Owner
Home Financials are based on the most recent Mortgage that was taken out on this home.
Original Mortgage
$384,510
Interest Rate
5%
Mortgage Type
New Conventional
Purchase Details
Closed on
May 2, 2003
Sold by
Baily Sandy L
Bought by
Chu Lorenz Howard K and Chu Kuo Shu
Home Financials for this Owner
Home Financials are based on the most recent Mortgage that was taken out on this home.
Original Mortgage
$483,750
Interest Rate
5.84%
Mortgage Type
Purchase Money Mortgage
Create a Home Valuation Report for This Property
The Home Valuation Report is an in-depth analysis detailing your home's value as well as a comparison with similar homes in the area
Home Values in the Area
Average Home Value in this Area
Purchase History
| Date | Buyer | Sale Price | Title Company |
|---|---|---|---|
| Lorenz Howard K | -- | None Available | |
| Lorenz Howard K | -- | Servicelink | |
| Chu Lorenz Howard K | $645,000 | Chicago Title |
Source: Public Records
Mortgage History
| Date | Status | Borrower | Loan Amount |
|---|---|---|---|
| Closed | Lorenz Howard K | $384,510 | |
| Closed | Chu Lorenz Howard K | $483,750 |
Source: Public Records
Tax History
| Year | Tax Paid | Tax Assessment Tax Assessment Total Assessment is a certain percentage of the fair market value that is determined by local assessors to be the total taxable value of land and additions on the property. | Land | Improvement |
|---|---|---|---|---|
| 2025 | $12,054 | $933,798 | $681,580 | $252,218 |
| 2024 | $12,054 | $915,489 | $668,216 | $247,273 |
| 2023 | $11,890 | $897,539 | $655,114 | $242,425 |
| 2022 | $11,827 | $879,941 | $642,269 | $237,672 |
| 2021 | $11,610 | $862,688 | $629,676 | $233,012 |
| 2020 | $11,308 | $853,843 | $623,220 | $230,623 |
| 2019 | $11,147 | $837,101 | $611,000 | $226,101 |
| 2018 | $10,717 | $820,688 | $599,020 | $221,668 |
| 2017 | $10,561 | $804,597 | $587,275 | $217,322 |
| 2016 | $9,930 | $788,821 | $575,760 | $213,061 |
| 2015 | $9,760 | $776,973 | $567,112 | $209,861 |
| 2014 | $9,414 | $761,755 | $556,004 | $205,751 |
Source: Public Records
Map
Nearby Homes
- 63 Braxton Terrace
- 101 Sunnyside Ave
- 188 W Rincon Ave
- 186 W Rincon Ave
- 87 Salice Way
- 143 Kennedy Ave
- 206 Sunnyside Ave
- 77 S 1st St
- 122 Timber Cove Dr Unit 122
- 870 Camden Ave Unit 96
- 99 Timber Cove Dr Unit 99
- 123 Dot Ave
- 47 Dot Ave Unit D
- 466 Sam Cava Ln
- 283 Esther Ave
- 425 Queens Ct
- 331 N 1st St Unit 3
- 341 Carlyn Ave
- 738 Sobrato Dr
- 271 Wagon Way Unit 38-03 - Plan 4
Your Personal Tour Guide
Ask me questions while you tour the home.