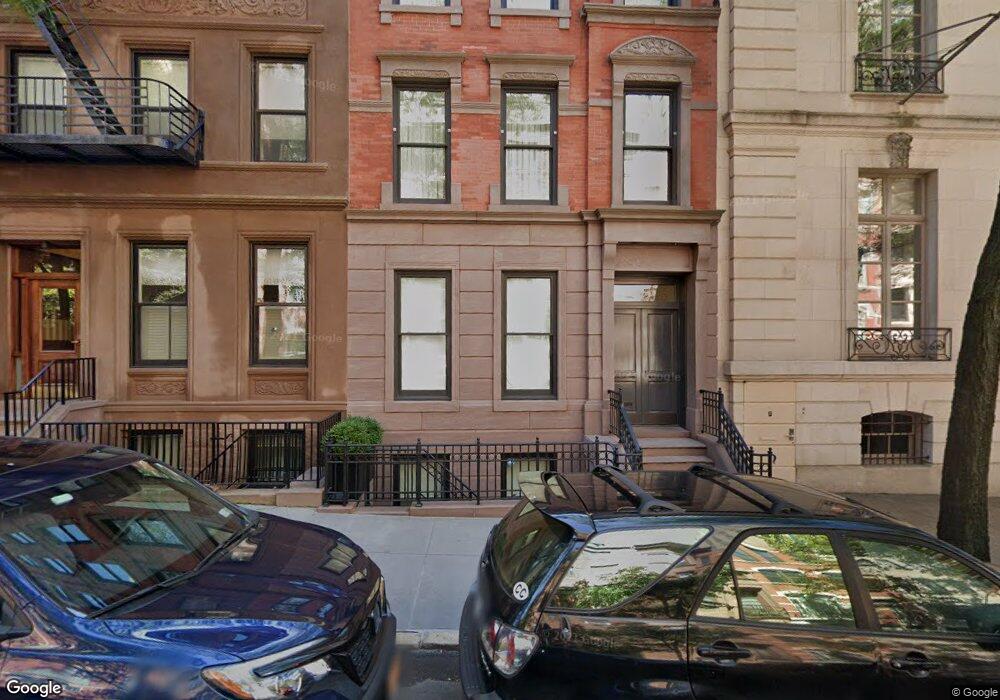
66 E 93rd St New York, NY 10128
Carnegie Hill NeighborhoodEstimated Value: $6,376,000 - $13,297,585
--
Bed
--
Bath
6,385
Sq Ft
$1,524/Sq Ft
Est. Value
About This Home
This home is located at 66 E 93rd St, New York, NY 10128 and is currently estimated at $9,731,195, approximately $1,524 per square foot. 66 E 93rd St is a home located in New York County with nearby schools including Ps 198 Isador E Ida Straus, Robert F Wagner Middle School, and Clinton School.
Ownership History
Date
Name
Owned For
Owner Type
Purchase Details
Closed on
May 12, 2024
Sold by
Caryn Seidman Becker and Morty Trust U/A/D 0/2019
Bought by
Becker Caryn Seidman
Current Estimated Value
Purchase Details
Closed on
Aug 8, 2023
Sold by
Becker Caryn
Bought by
Caryn Becker and Morty Trust C U/A/D 0/19
Purchase Details
Closed on
Dec 17, 2009
Sold by
66 East 93Rd Street Llc and % Orbimed Advisors Llc
Bought by
Wohc Llc
Purchase Details
Closed on
Jun 26, 2009
Sold by
Estate Of Frederick A Schauffler and Estate Of Frederick Allen Schauffler
Bought by
66 East 93Rd Street Llc
Home Financials for this Owner
Home Financials are based on the most recent Mortgage that was taken out on this home.
Original Mortgage
$2,782,482
Interest Rate
4.93%
Mortgage Type
Purchase Money Mortgage
Create a Home Valuation Report for This Property
The Home Valuation Report is an in-depth analysis detailing your home's value as well as a comparison with similar homes in the area
Home Values in the Area
Average Home Value in this Area
Purchase History
| Date | Buyer | Sale Price | Title Company |
|---|---|---|---|
| Becker Caryn Seidman | -- | -- | |
| Caryn Seidman Becker | -- | -- | |
| Caryn Seidman Becker | -- | -- | |
| Becker Caryn Seidman | -- | -- | |
| Caryn Seidman Becker | -- | -- | |
| Caryn Becker | -- | -- | |
| Marc E Becker | -- | -- | |
| Caryn Becker | -- | -- | |
| Marc E Becker | -- | -- | |
| Wohc Llc | $8,450,000 | -- | |
| Wohc Llc | $8,450,000 | -- | |
| 66 East 93Rd Street Llc | $6,500,000 | -- | |
| 66 East 93Rd Street Llc | $6,500,000 | -- |
Source: Public Records
Mortgage History
| Date | Status | Borrower | Loan Amount |
|---|---|---|---|
| Previous Owner | 66 East 93Rd Street Llc | $2,782,482 |
Source: Public Records
Tax History Compared to Growth
Tax History
| Year | Tax Paid | Tax Assessment Tax Assessment Total Assessment is a certain percentage of the fair market value that is determined by local assessors to be the total taxable value of land and additions on the property. | Land | Improvement |
|---|---|---|---|---|
| 2025 | $150,561 | $719,160 | $397,299 | $321,861 |
| 2024 | $150,561 | $749,620 | $359,580 | $409,539 |
| 2023 | $143,623 | $707,189 | $314,009 | $393,180 |
| 2022 | $141,176 | $858,900 | $359,580 | $499,320 |
| 2021 | $147,714 | $922,980 | $359,580 | $563,400 |
| 2020 | $140,160 | $789,000 | $359,580 | $429,420 |
| 2019 | $130,677 | $786,300 | $359,580 | $426,720 |
| 2018 | $120,134 | $589,324 | $181,361 | $407,963 |
| 2017 | $120,134 | $589,324 | $135,876 | $453,448 |
| 2016 | $116,930 | $584,912 | $150,162 | $434,750 |
| 2015 | -- | $551,804 | $199,818 | $351,986 |
| 2014 | -- | $520,570 | $226,212 | $294,358 |
Source: Public Records
Map
Nearby Homes
- 1295 Madison Ave Unit 3
- 1295 Madison Ave Unit 4 B
- 46 E 92nd St Unit 1
- 68 E 93rd St Unit 1F
- 70 E 93rd St Unit 3B
- 72 E 93rd St Unit 5 AB
- 1160 Park Ave Unit 7C
- 1281 Madison Ave Unit TH1
- 55 E 93rd St Unit 5E
- 47 E 91st St Unit 2
- 1150 Park Ave Unit 2F
- 1150 Park Ave Unit 8B
- 1150 Park Ave Unit 3F
- 40 E 94th St Unit 13G
- 40 E 94th St Unit 3D
- 40 E 94th St Unit 11A
- 67 E 93rd St
- 19 E 92nd St
- 64 E 94th St Unit 1G
- 64 E 94th St Unit 3
- 68 E 93rd St
- 68 E 93rd St
- 68 E 93rd St Unit 4R
- 68 E 93rd St Unit 5F
- 68 E 93rd St Unit 2R
- 68 E 93rd St Unit 34F
- 68 E 93rd St Unit 3R
- 68 E 93rd St Unit 1R
- 68 E 93rd St Unit 5R
- 60 E 93rd St
- 61 E 92nd St
- 70 E 93rd St
- 70 E 93rd St Unit 5B
- 70 E 93rd St Unit 4B
- 70 E 93rd St Unit 3A
- 70 E 93rd St Unit 5A
- 70 E 93rd St Unit 2B
- 70 E 93rd St Unit 4A
- 70 E 93rd St Unit 2A
- 70 E 93rd St Unit 1B