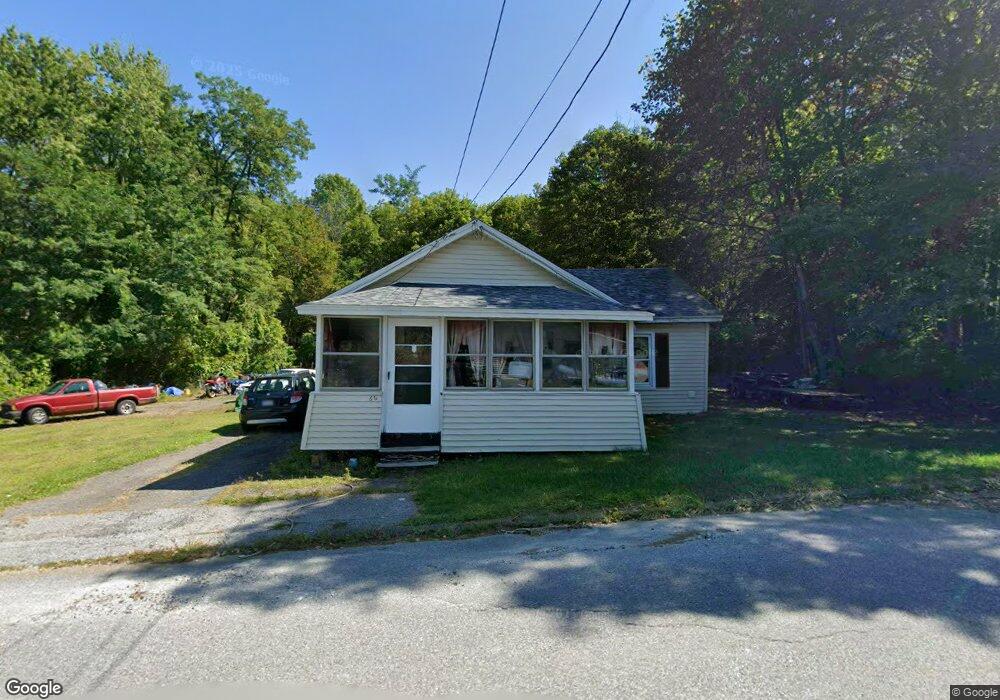
66 E St North Adams, MA 01247
Estimated Value: $166,260 - $260,000
2
Beds
1
Bath
815
Sq Ft
$244/Sq Ft
Est. Value
About This Home
This home is located at 66 E St, North Adams, MA 01247 and is currently estimated at $199,065, approximately $244 per square foot. 66 E St is a home located in Berkshire County with nearby schools including Brayton Elementary School, Drury High School, and Berkshire Arts & Technology Charter Public School.
Ownership History
Date
Name
Owned For
Owner Type
Purchase Details
Closed on
Jun 19, 1998
Sold by
Champagne Rose D
Bought by
Fachini Michael A
Current Estimated Value
Home Financials for this Owner
Home Financials are based on the most recent Mortgage that was taken out on this home.
Original Mortgage
$58,000
Outstanding Balance
$11,644
Interest Rate
7.09%
Mortgage Type
Purchase Money Mortgage
Estimated Equity
$187,421
Create a Home Valuation Report for This Property
The Home Valuation Report is an in-depth analysis detailing your home's value as well as a comparison with similar homes in the area
Home Values in the Area
Average Home Value in this Area
Purchase History
| Date | Buyer | Sale Price | Title Company |
|---|---|---|---|
| Fachini Michael A | $58,000 | -- | |
| Fachini Michael A | $58,000 | -- |
Source: Public Records
Mortgage History
| Date | Status | Borrower | Loan Amount |
|---|---|---|---|
| Open | Fachini Michael A | $58,000 | |
| Closed | Fachini Michael A | $58,000 |
Source: Public Records
Tax History
| Year | Tax Paid | Tax Assessment Tax Assessment Total Assessment is a certain percentage of the fair market value that is determined by local assessors to be the total taxable value of land and additions on the property. | Land | Improvement |
|---|---|---|---|---|
| 2025 | $1,917 | $114,700 | $38,300 | $76,400 |
| 2024 | $1,798 | $104,900 | $35,000 | $69,900 |
| 2023 | $1,749 | $99,000 | $35,000 | $64,000 |
| 2022 | $1,636 | $88,300 | $35,000 | $53,300 |
| 2021 | $1,520 | $81,700 | $32,400 | $49,300 |
| 2020 | $1,436 | $77,100 | $32,300 | $44,800 |
| 2019 | $1,401 | $73,300 | $32,300 | $41,000 |
| 2018 | $1,362 | $74,100 | $33,900 | $40,200 |
| 2017 | $1,299 | $73,500 | $33,600 | $39,900 |
| 2016 | $1,334 | $76,700 | $33,600 | $43,100 |
| 2015 | $1,300 | $77,900 | $34,800 | $43,100 |
Source: Public Records
Map
Nearby Homes
Your Personal Tour Guide
Ask me questions while you tour the home.