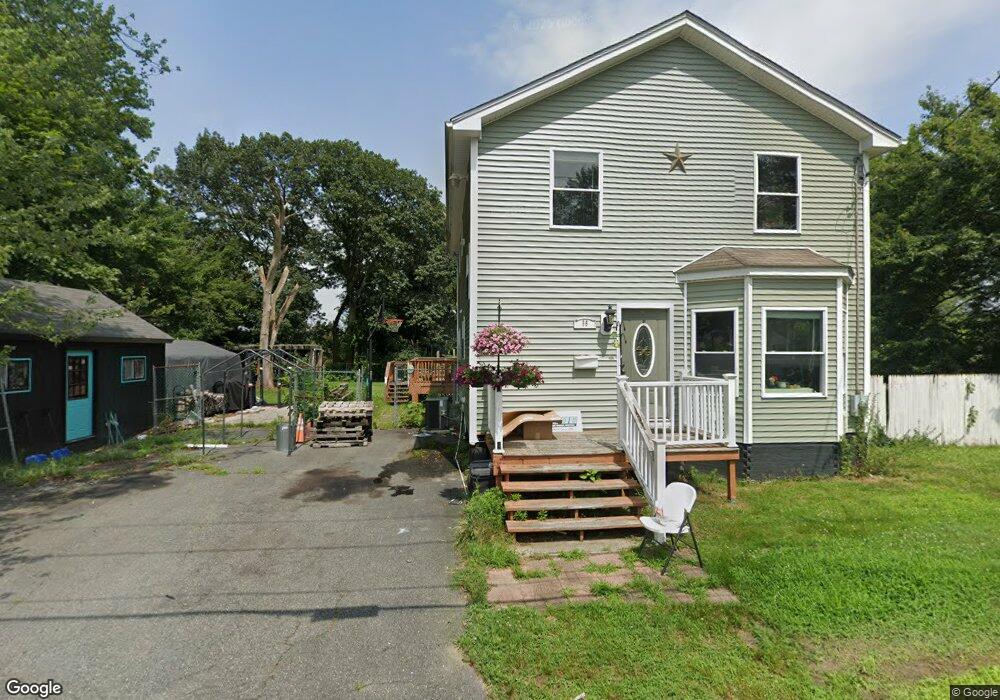
66 Eddy St Cranston, RI 02920
Garden City NeighborhoodEstimated Value: $449,000 - $472,793
3
Beds
1
Bath
1,178
Sq Ft
$390/Sq Ft
Est. Value
About This Home
This home is located at 66 Eddy St, Cranston, RI 02920 and is currently estimated at $459,698, approximately $390 per square foot. 66 Eddy St is a home located in Providence County with nearby schools including Garden City School, Western Hills Middle School, and Cranston High School West.
Ownership History
Date
Name
Owned For
Owner Type
Purchase Details
Closed on
Oct 5, 2016
Sold by
Rodrigues Karen G and Rodrigues Michael
Bought by
Rodrigues Michael
Current Estimated Value
Purchase Details
Closed on
Aug 14, 1997
Sold by
Yardley Group Inc
Bought by
Rodrigues Karen G and Gorton Antoinette M
Create a Home Valuation Report for This Property
The Home Valuation Report is an in-depth analysis detailing your home's value as well as a comparison with similar homes in the area
Home Values in the Area
Average Home Value in this Area
Purchase History
| Date | Buyer | Sale Price | Title Company |
|---|---|---|---|
| Rodrigues Michael | -- | -- | |
| Rodrigues Karen G | $63,000 | -- |
Source: Public Records
Mortgage History
| Date | Status | Borrower | Loan Amount |
|---|---|---|---|
| Previous Owner | Rodrigues Karen G | $37,000 | |
| Previous Owner | Rodrigues Karen G | $75,000 | |
| Previous Owner | Rodrigues Karen G | $244,000 |
Source: Public Records
Tax History
| Year | Tax Paid | Tax Assessment Tax Assessment Total Assessment is a certain percentage of the fair market value that is determined by local assessors to be the total taxable value of land and additions on the property. | Land | Improvement |
|---|---|---|---|---|
| 2025 | $5,030 | $362,400 | $109,700 | $252,700 |
| 2024 | $4,932 | $362,400 | $109,700 | $252,700 |
| 2023 | $4,884 | $258,400 | $75,600 | $182,800 |
| 2022 | $4,783 | $258,400 | $75,600 | $182,800 |
| 2021 | $4,651 | $258,400 | $75,600 | $182,800 |
| 2020 | $4,258 | $205,000 | $58,800 | $146,200 |
| 2019 | $4,258 | $205,000 | $58,800 | $146,200 |
| 2018 | $4,159 | $205,000 | $58,800 | $146,200 |
| 2017 | $4,150 | $180,900 | $46,200 | $134,700 |
| 2016 | $4,061 | $180,900 | $46,200 | $134,700 |
| 2015 | $4,061 | $180,900 | $46,200 | $134,700 |
| 2014 | $3,645 | $159,600 | $46,200 | $113,400 |
Source: Public Records
Map
Nearby Homes
- 127 Dellwood Rd
- 859 Pontiac Ave
- 55 Cypress Dr
- 44 Holburn Ave
- 24 Elm Cir
- 54 Holburn Ave
- 150 Riverside Ave
- 33 Hemlock Ave
- 22 Phillips Ave
- 123 Harper Ave
- 1000 Chapel View Blvd Unit 312
- 103 Harper Ave
- 346 Chestnut St
- 95 Nolbeth Dr
- 175 Hoffman Ave Unit 102
- 228 3rd Ave
- 10 Dale Ave
- 29 Poppy Dr
- 175 Pettaconsett Ave
- 396 Elm St
Your Personal Tour Guide
Ask me questions while you tour the home.