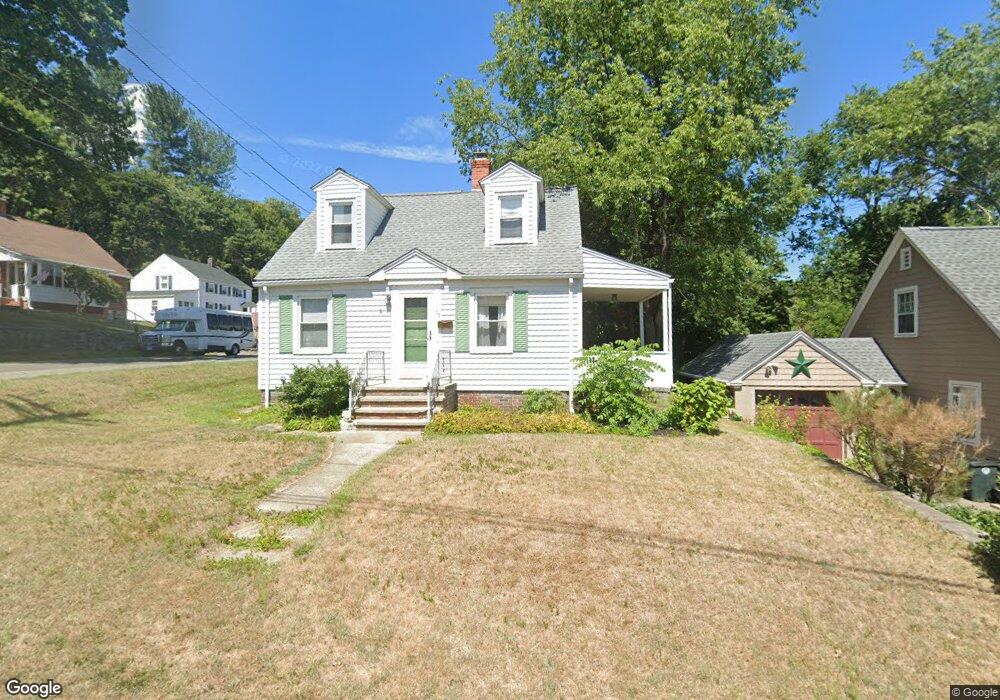
66 Eggleston St Torrington, CT 06790
Estimated Value: $227,000 - $276,000
2
Beds
2
Baths
1,055
Sq Ft
$234/Sq Ft
Est. Value
About This Home
This home is located at 66 Eggleston St, Torrington, CT 06790 and is currently estimated at $247,331, approximately $234 per square foot. 66 Eggleston St is a home located in Litchfield County with nearby schools including Torrington Middle School, Torrington High School, and St. Peter School.
Ownership History
Date
Name
Owned For
Owner Type
Purchase Details
Closed on
Jun 30, 2004
Sold by
Petersen Christopher D
Bought by
Morrow Elizabeth A
Current Estimated Value
Purchase Details
Closed on
Apr 1, 2002
Sold by
Miller Christopher and Camire Nadine
Bought by
Petersen Christopher D
Home Financials for this Owner
Home Financials are based on the most recent Mortgage that was taken out on this home.
Original Mortgage
$103,300
Interest Rate
6.88%
Purchase Details
Closed on
Jun 25, 1999
Sold by
Ocwen Fed Bank Fsb
Bought by
Miller Christopher and Camire Nadine
Home Financials for this Owner
Home Financials are based on the most recent Mortgage that was taken out on this home.
Original Mortgage
$44,000
Interest Rate
7.63%
Purchase Details
Closed on
Jun 21, 1988
Sold by
Domingue Oliver
Bought by
Kelley Jeffrey S
Create a Home Valuation Report for This Property
The Home Valuation Report is an in-depth analysis detailing your home's value as well as a comparison with similar homes in the area
Home Values in the Area
Average Home Value in this Area
Purchase History
| Date | Buyer | Sale Price | Title Company |
|---|---|---|---|
| Morrow Elizabeth A | $138,900 | -- | |
| Petersen Christopher D | $105,000 | -- | |
| Miller Christopher | $55,000 | -- | |
| Kelley Jeffrey S | $118,000 | -- |
Source: Public Records
Mortgage History
| Date | Status | Borrower | Loan Amount |
|---|---|---|---|
| Open | Kelley Jeffrey S | $99,200 | |
| Closed | Kelley Jeffrey S | $111,000 | |
| Previous Owner | Kelley Jeffrey S | $103,300 | |
| Previous Owner | Kelley Jeffrey S | $44,000 |
Source: Public Records
Tax History
| Year | Tax Paid | Tax Assessment Tax Assessment Total Assessment is a certain percentage of the fair market value that is determined by local assessors to be the total taxable value of land and additions on the property. | Land | Improvement |
|---|---|---|---|---|
| 2025 | $5,461 | $142,030 | $23,520 | $118,510 |
| 2024 | $3,484 | $72,630 | $23,520 | $49,110 |
| 2023 | $3,483 | $72,630 | $23,520 | $49,110 |
| 2022 | $3,424 | $72,630 | $23,520 | $49,110 |
| 2021 | $3,353 | $72,630 | $23,520 | $49,110 |
| 2020 | $3,353 | $72,630 | $23,520 | $49,110 |
| 2019 | $3,140 | $68,000 | $28,900 | $39,100 |
| 2018 | $3,140 | $68,000 | $28,900 | $39,100 |
| 2017 | $3,111 | $68,000 | $28,900 | $39,100 |
| 2016 | $3,111 | $68,000 | $28,900 | $39,100 |
| 2015 | $3,111 | $68,000 | $28,900 | $39,100 |
| 2014 | $3,287 | $90,500 | $37,430 | $53,070 |
Source: Public Records
Map
Nearby Homes
- 58 Eggleston St
- 0 Highland Ave Unit 24088105
- 80 Washington Ave
- 115 Beechwood Ave
- 69 McGuinness St
- 42 Pulver St
- 329 Church St
- 146 Beechwood Ave
- 155 Allen Rd
- 0 Red Mountain Ave
- 305 Westledge Dr
- 163 Beechwood Ave
- 116 High St
- 68 Westledge Terrace
- 108 Culvert St
- 30 Culvert St
- 7 Ford Ln
- 231 Beechwood Ave
- 118 Pearl St
- 00 Church St
- 50 Eggleston St
- 194 Spring St
- 179 Spring St
- 185 Spring St
- 195 Spring St
- 67 Eggleston St
- 167 Spring St
- 44 Eggleston St
- 59 Eggleston St
- 165 Sharon Ave
- 89 Eggleston St
- 203 Spring St
- 204 Spring St
- 40 Eggleston St
- 159 Spring St
- 144 Spring St
- 104 Eggleston St
- 153 Sharon Ave
- 97 Eggleston St
- 28 Eggleston St
Your Personal Tour Guide
Ask me questions while you tour the home.