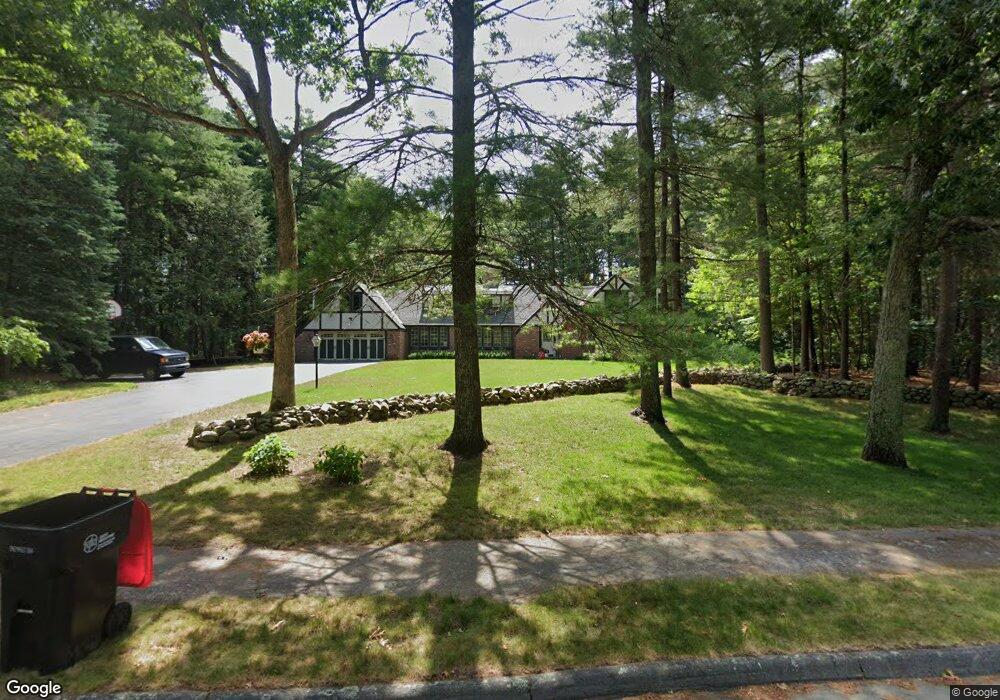
66 Fairway Ln Foxboro, MA 02035
Estimated Value: $930,000 - $1,261,000
5
Beds
3
Baths
4,207
Sq Ft
$272/Sq Ft
Est. Value
About This Home
This home is located at 66 Fairway Ln, Foxboro, MA 02035 and is currently estimated at $1,145,173, approximately $272 per square foot. 66 Fairway Ln is a home located in Norfolk County with nearby schools including Foxborough High School, Foxborough Regional Charter School, and Hands-On-Montessori School.
Ownership History
Date
Name
Owned For
Owner Type
Purchase Details
Closed on
Sep 14, 2023
Sold by
Congdon Dana B
Bought by
Flaherty Scott M and Flaherty Kristen J
Current Estimated Value
Home Financials for this Owner
Home Financials are based on the most recent Mortgage that was taken out on this home.
Original Mortgage
$533,000
Outstanding Balance
$520,542
Interest Rate
6.9%
Mortgage Type
Purchase Money Mortgage
Estimated Equity
$624,631
Purchase Details
Closed on
Dec 30, 1986
Bought by
Congdon Dana B
Create a Home Valuation Report for This Property
The Home Valuation Report is an in-depth analysis detailing your home's value as well as a comparison with similar homes in the area
Home Values in the Area
Average Home Value in this Area
Purchase History
| Date | Buyer | Sale Price | Title Company |
|---|---|---|---|
| Flaherty Scott M | $875,000 | None Available | |
| Congdon Dana B | -- | -- |
Source: Public Records
Mortgage History
| Date | Status | Borrower | Loan Amount |
|---|---|---|---|
| Open | Flaherty Scott M | $533,000 |
Source: Public Records
Tax History Compared to Growth
Tax History
| Year | Tax Paid | Tax Assessment Tax Assessment Total Assessment is a certain percentage of the fair market value that is determined by local assessors to be the total taxable value of land and additions on the property. | Land | Improvement |
|---|---|---|---|---|
| 2025 | $14,759 | $1,116,400 | $308,000 | $808,400 |
| 2024 | $11,119 | $823,000 | $307,400 | $515,600 |
| 2023 | $10,679 | $751,500 | $293,100 | $458,400 |
| 2022 | $9,906 | $682,200 | $240,700 | $441,500 |
| 2021 | $9,612 | $652,100 | $234,200 | $417,900 |
| 2020 | $9,253 | $635,100 | $234,200 | $400,900 |
| 2019 | $9,143 | $622,000 | $243,900 | $378,100 |
| 2018 | $8,899 | $610,800 | $243,900 | $366,900 |
| 2017 | $8,480 | $563,800 | $237,900 | $325,900 |
| 2016 | $8,250 | $556,700 | $209,900 | $346,800 |
| 2015 | $7,911 | $520,800 | $174,000 | $346,800 |
| 2014 | $7,736 | $516,100 | $169,300 | $346,800 |
Source: Public Records
Map
Nearby Homes
- 406 South St
- 80 Mill St
- 356 Central St
- 450 West St
- 12 Spring St
- 277 Central St
- 166 Chauncy St
- 16 Treasure Island Rd
- 11 W Belcher Rd Unit 2
- 14 Baker St
- 24 Mechanic St
- 24 Maverick Dr
- 11 Orchard Place Unit 11
- 28 Angell St
- 44 Angell St Unit 44
- 18 Winter St Unit E
- 84 Cocasset St Unit A6
- 619 N Main St
- 14 Winter St Unit B
- 22 Pleasant St Unit C