
66 Flint St Springfield, MA 01129
Boston Road Neighborhood
3
Beds
1
Bath
1,040
Sq Ft
0.25
Acres
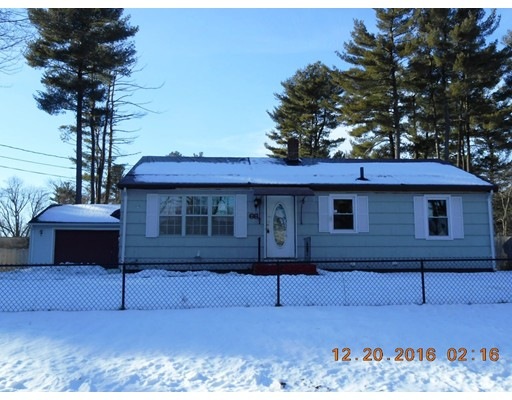
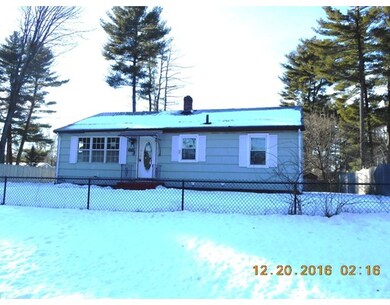
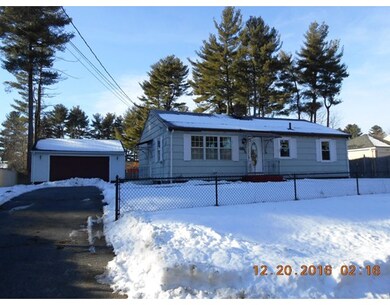
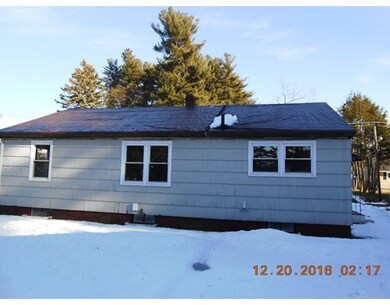
About This Home
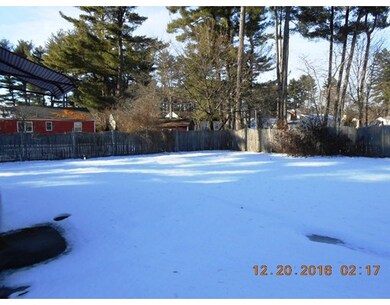
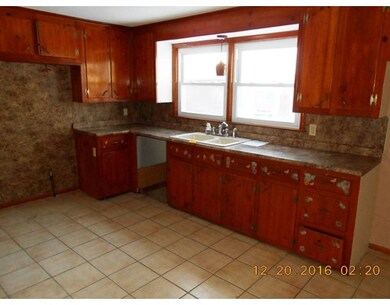
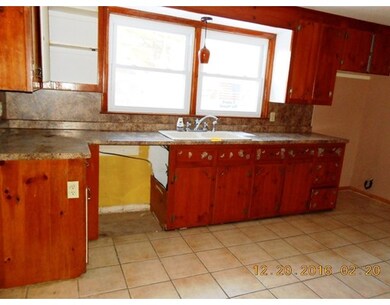
As of May 2020This potentially charming 3 bedroom ,1 bath ranch is located near to many amenities. Property is in need of some work and is a perfect project house. This property is corporate-owned and being sold in "AS-IS" condition, no warranties or representation made by the seller.***PROPERTY HAS MULTIPLE OFFERS, HIGHEST & BEST OFFERS DUE BY 12/28/16 AT 9AM***
Last Agent to Sell the Property
Ideal Real Estate Services, Inc. Listed on: 12/20/2016
Home Details
Home Type
Single Family
Est. Annual Taxes
$3,911
Year Built
1955
Lot Details
0
Listing Details
- Lot Description: Paved Drive
- Property Type: Single Family
- Other Agent: 2.50
- Lead Paint: Unknown
- Special Features: 20
- Property Sub Type: Detached
- Year Built: 1955
Interior Features
- Has Basement: Yes
- Number of Rooms: 5
- Amenities: Public Transportation, Shopping
- Electric: Circuit Breakers
- Energy: Insulated Windows
- Flooring: Wood, Tile
- Basement: Full, Interior Access, Concrete Floor
- Bedroom 2: First Floor
- Bedroom 3: First Floor
- Bathroom #1: First Floor
- Kitchen: First Floor
- Living Room: First Floor
- Master Bedroom: First Floor
- Master Bedroom Description: Closet, Flooring - Wood, Main Level
Exterior Features
- Roof: Asphalt/Fiberglass Shingles
- Construction: Frame
- Exterior: Wood
- Exterior Features: Fenced Yard
- Foundation: Poured Concrete
Garage/Parking
- Garage Spaces: 2
- Parking: Off-Street, Paved Driveway
- Parking Spaces: 4
Utilities
- Heating: Forced Air, Gas
- Utility Connections: for Electric Range
- Sewer: City/Town Sewer
- Water: City/Town Water
Lot Info
- Assessor Parcel Number: S:05195 P:0162
- Zoning: Res
Ownership History
Date
Name
Owned For
Owner Type
Purchase Details
Listed on
Apr 2, 2020
Closed on
Apr 29, 2020
Sold by
Rosario Orlando
Bought by
Rattelle Diane L
Seller's Agent
Philip Houser
Houser Metro Realty
Buyer's Agent
Markus Lauria
Gallagher Real Estate
List Price
$215,000
Sold Price
$215,000
Total Days on Market
14
Current Estimated Value
Home Financials for this Owner
Home Financials are based on the most recent Mortgage that was taken out on this home.
Estimated Appreciation
$117,470
Avg. Annual Appreciation
7.56%
Original Mortgage
$10,000
Outstanding Balance
$8,942
Interest Rate
3.2%
Mortgage Type
Second Mortgage Made To Cover Down Payment
Estimated Equity
$304,825
Purchase Details
Listed on
Jun 6, 2017
Closed on
Jul 26, 2017
Sold by
Property Keys Llc
Bought by
Rosario Orlando
Seller's Agent
Natasha Quiles
Real Estate Keys
Buyer's Agent
Philip Houser
Houser Metro Realty
List Price
$168,000
Sold Price
$180,000
Premium/Discount to List
$12,000
7.14%
Home Financials for this Owner
Home Financials are based on the most recent Mortgage that was taken out on this home.
Avg. Annual Appreciation
6.46%
Original Mortgage
$176,739
Interest Rate
3.75%
Mortgage Type
FHA
Purchase Details
Listed on
Dec 20, 2016
Closed on
Jan 31, 2017
Sold by
Us Bank Na Tr
Bought by
Property Keys Llc
Seller's Agent
Carlos Dos Santos
Ideal Real Estate Services, Inc.
Buyer's Agent
Natasha Quiles
Real Estate Keys
List Price
$73,500
Sold Price
$85,200
Premium/Discount to List
$11,700
15.92%
Home Financials for this Owner
Home Financials are based on the most recent Mortgage that was taken out on this home.
Avg. Annual Appreciation
375.05%
Purchase Details
Listed on
Dec 20, 2016
Closed on
Jan 19, 2017
Sold by
Garcia Santos
Bought by
Us Bank Na Tr
Seller's Agent
Carlos Dos Santos
Ideal Real Estate Services, Inc.
Buyer's Agent
Natasha Quiles
Real Estate Keys
List Price
$73,500
Sold Price
$85,200
Premium/Discount to List
$11,700
15.92%
Purchase Details
Closed on
Jul 20, 2010
Sold by
Garcia Gregory
Bought by
Garcia Santos
Home Financials for this Owner
Home Financials are based on the most recent Mortgage that was taken out on this home.
Original Mortgage
$154,913
Interest Rate
5.25%
Mortgage Type
FHA
Purchase Details
Closed on
Jan 19, 2007
Sold by
Mcmullin Eleanor M and Carranza Marion
Bought by
Garcia Gregory
Home Financials for this Owner
Home Financials are based on the most recent Mortgage that was taken out on this home.
Original Mortgage
$106,296
Interest Rate
6.14%
Mortgage Type
Purchase Money Mortgage
Similar Home in Springfield, MA
Create a Home Valuation Report for This Property
The Home Valuation Report is an in-depth analysis detailing your home's value as well as a comparison with similar homes in the area
Home Values in the Area
Average Home Value in this Area
Purchase History
| Date | Type | Sale Price | Title Company |
|---|---|---|---|
| Not Resolvable | $215,000 | None Available | |
| Not Resolvable | $180,000 | -- | |
| Not Resolvable | $85,200 | -- | |
| Foreclosure Deed | $150,000 | -- | |
| Deed | $157,000 | -- | |
| Deed | $132,870 | -- |
Source: Public Records
Mortgage History
| Date | Status | Loan Amount | Loan Type |
|---|---|---|---|
| Open | $10,000 | Second Mortgage Made To Cover Down Payment | |
| Open | $200,000 | New Conventional | |
| Previous Owner | $176,739 | FHA | |
| Previous Owner | $154,913 | FHA | |
| Previous Owner | $106,296 | Purchase Money Mortgage | |
| Previous Owner | $26,574 | No Value Available |
Source: Public Records
Property History
| Date | Event | Price | Change | Sq Ft Price |
|---|---|---|---|---|
| 05/27/2020 05/27/20 | Sold | $215,000 | 0.0% | $140 / Sq Ft |
| 04/09/2020 04/09/20 | Pending | -- | -- | -- |
| 04/02/2020 04/02/20 | For Sale | $215,000 | +19.4% | $140 / Sq Ft |
| 07/26/2017 07/26/17 | Sold | $180,000 | 0.0% | $173 / Sq Ft |
| 06/09/2017 06/09/17 | Price Changed | $180,000 | +7.1% | $173 / Sq Ft |
| 06/09/2017 06/09/17 | Pending | -- | -- | -- |
| 06/06/2017 06/06/17 | For Sale | $168,000 | +97.2% | $162 / Sq Ft |
| 01/31/2017 01/31/17 | Sold | $85,200 | +15.9% | $82 / Sq Ft |
| 01/03/2017 01/03/17 | Pending | -- | -- | -- |
| 12/20/2016 12/20/16 | For Sale | $73,500 | -- | $71 / Sq Ft |
Source: MLS Property Information Network (MLS PIN)
Tax History Compared to Growth
Tax History
| Year | Tax Paid | Tax Assessment Tax Assessment Total Assessment is a certain percentage of the fair market value that is determined by local assessors to be the total taxable value of land and additions on the property. | Land | Improvement |
|---|---|---|---|---|
| 2025 | $3,911 | $249,400 | $58,200 | $191,200 |
| 2024 | $3,774 | $235,000 | $58,200 | $176,800 |
| 2023 | $3,517 | $206,300 | $55,400 | $150,900 |
| 2022 | $3,817 | $202,800 | $55,400 | $147,400 |
| 2021 | $3,485 | $184,400 | $50,300 | $134,100 |
| 2020 | $3,355 | $171,800 | $50,300 | $121,500 |
| 2019 | $3,107 | $157,900 | $50,300 | $107,600 |
| 2018 | $2,910 | $158,500 | $50,300 | $108,200 |
| 2017 | $2,910 | $148,000 | $45,300 | $102,700 |
| 2016 | $2,788 | $141,800 | $45,300 | $96,500 |
| 2015 | $2,797 | $142,200 | $45,300 | $96,900 |
Source: Public Records
Agents Affiliated with this Home
-
P
Seller's Agent in 2020
Philip Houser
Houser Metro Realty
(413) 567-6438
2 Total Sales
-
M
Buyer's Agent in 2020
Markus Lauria
Gallagher Real Estate
-
Seller's Agent in 2017
Natasha Quiles
Real Estate Keys
(413) 883-6621
56 Total Sales
-
Seller's Agent in 2017
Carlos Dos Santos
Ideal Real Estate Services, Inc.
(413) 531-1159
58 Total Sales
Map
Source: MLS Property Information Network (MLS PIN)
MLS Number: 72102798
APN: SPRI-005195-000000-000162
Disclaimer: Certain information contained herein is derived from information provided by parties other than Homes.com. All information provided is deemed reliable, but is not guaranteed to be accurate and should be independently verified.
![]() The property listing data and information, or the Images, set forth herein were provided to MLS Property Information Network, Inc. from third party sources, including sellers, lessors and public records, and were compiled by MLS Property Information Network, Inc. The property listing data and information, and the Images, are for the personal, non-commercial use of consumers having a good faith interest in purchasing or leasing listed properties of the type displayed to them and may not be used for any purpose other than to identify prospective properties which such consumers may have a good faith interest in purchasing or leasing. MLS Property Information Network, Inc. and its subscribers disclaim any and all representations and warranties as to the accuracy of the property listing data and information, or as to the accuracy of any of the Images, set forth herein.
The property listing data and information, or the Images, set forth herein were provided to MLS Property Information Network, Inc. from third party sources, including sellers, lessors and public records, and were compiled by MLS Property Information Network, Inc. The property listing data and information, and the Images, are for the personal, non-commercial use of consumers having a good faith interest in purchasing or leasing listed properties of the type displayed to them and may not be used for any purpose other than to identify prospective properties which such consumers may have a good faith interest in purchasing or leasing. MLS Property Information Network, Inc. and its subscribers disclaim any and all representations and warranties as to the accuracy of the property listing data and information, or as to the accuracy of any of the Images, set forth herein.
Nearby Homes