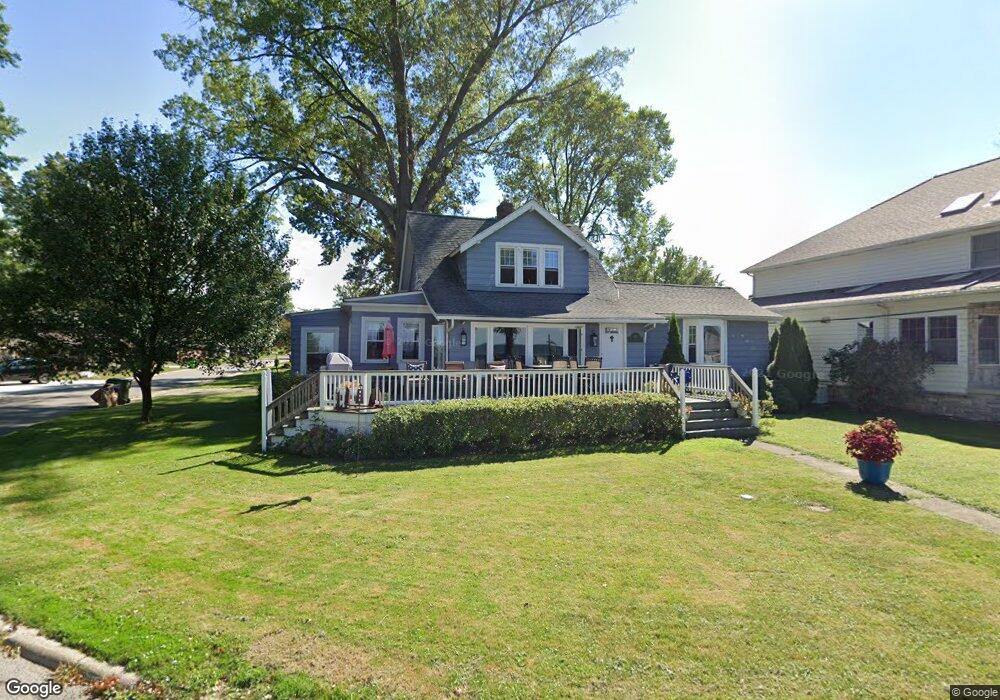
66 Gra Gull Dr Avon Lake, OH 44012
Estimated Value: $292,000 - $337,000
2
Beds
2
Baths
1,586
Sq Ft
$195/Sq Ft
Est. Value
About This Home
This home is located at 66 Gra Gull Dr, Avon Lake, OH 44012 and is currently estimated at $308,614, approximately $194 per square foot. 66 Gra Gull Dr is a home located in Lorain County with nearby schools including Erieview Elementary School, Troy Intermediate Elementary School, and Learwood Middle School.
Ownership History
Date
Name
Owned For
Owner Type
Purchase Details
Closed on
Jun 18, 2018
Sold by
Finnan Shawn
Bought by
O'Donnell Siobhan M
Current Estimated Value
Purchase Details
Closed on
Apr 7, 2010
Sold by
Estate Of Carol Finnan
Bought by
Finnan Carol
Purchase Details
Closed on
Mar 29, 2010
Sold by
Finnan Gregory F
Bought by
Finnan Shawn
Purchase Details
Closed on
Jul 27, 2005
Sold by
Estate Of Gregory Finnan
Bought by
Finnan Carol M
Purchase Details
Closed on
Sep 14, 2002
Sold by
Miller C Joe and Miller Miklovic Mary Lynne
Bought by
Finnan G Gregory and Finnan Carol
Home Financials for this Owner
Home Financials are based on the most recent Mortgage that was taken out on this home.
Original Mortgage
$170,400
Interest Rate
6.24%
Purchase Details
Closed on
Aug 29, 2000
Sold by
Miller Lorena and Miller Lorena H
Bought by
Miller C Joe and Miller Miklovic Mary Lynne
Create a Home Valuation Report for This Property
The Home Valuation Report is an in-depth analysis detailing your home's value as well as a comparison with similar homes in the area
Home Values in the Area
Average Home Value in this Area
Purchase History
| Date | Buyer | Sale Price | Title Company |
|---|---|---|---|
| O'Donnell Siobhan M | $150,000 | None Available | |
| Finnan Carol | -- | None Available | |
| Finnan Shawn | -- | Attorney | |
| Finnan Carol M | -- | None Available | |
| Finnan G Gregory | $213,000 | Guardian Title | |
| Miller C Joe | -- | Guardian Title |
Source: Public Records
Mortgage History
| Date | Status | Borrower | Loan Amount |
|---|---|---|---|
| Previous Owner | Finnan G Gregory | $170,400 |
Source: Public Records
Tax History Compared to Growth
Tax History
| Year | Tax Paid | Tax Assessment Tax Assessment Total Assessment is a certain percentage of the fair market value that is determined by local assessors to be the total taxable value of land and additions on the property. | Land | Improvement |
|---|---|---|---|---|
| 2024 | $4,388 | $90,293 | $17,108 | $73,185 |
| 2023 | $4,801 | $87,861 | $15,519 | $72,342 |
| 2022 | $4,753 | $87,861 | $15,519 | $72,342 |
| 2021 | $4,742 | $87,861 | $15,519 | $72,342 |
| 2020 | $3,411 | $58,570 | $14,130 | $44,440 |
| 2019 | $3,394 | $58,570 | $14,130 | $44,440 |
| 2018 | $3,317 | $58,570 | $14,130 | $44,440 |
| 2017 | $3,228 | $51,100 | $7,980 | $43,120 |
| 2016 | $3,212 | $51,100 | $7,980 | $43,120 |
| 2015 | $3,228 | $51,100 | $7,980 | $43,120 |
| 2014 | $3,104 | $44,600 | $6,960 | $37,640 |
| 2013 | $2,979 | $44,600 | $6,960 | $37,640 |
Source: Public Records
Map
Nearby Homes
- 137 Armour Rd
- 32894 Lake Rd
- 205 Sunset Rd
- 250 Vineyard Rd
- 151 Inwood Blvd
- 230 Glenview Dr
- 252 Yoder Blvd
- 223 Parsons Dr
- 126 Parkwood Ave
- 32863 Redwood Blvd
- S/L 2 Redwood Blvd
- 279 Briargate Ct
- 330 Inwood Blvd
- 417 Armour Rd
- 30 Landings Way Unit 30
- 32581 Captains Galley
- 80 Landings Way Unit 80
- 34 Community Dr Unit 34
- 110 Oakwood Dr
- 175 Curtis Dr
- 67 Maplecliff Dr
- 69 Maplecliff Dr
- 69 Maplecliff Dr
- 74 Gra Gull Dr
- 71 Gra Gull Dr
- 67 Gra Gull Dr
- 63 Gra Gull Dr
- 73 Maplecliff Dr
- 75 Gra Gull Dr
- 60 Maplecliff Dr
- 68 Maplecliff Dr
- 70 Maplecliff Dr
- 78 Gra Gull Dr
- 66 Maplecliff Dr
- 72 Maplecliff Dr
- 75 Maplecliff Dr
- 81 Gra Gull Dr
- 74 Maplecliff Dr
- 32644 Lake Rd
- 32596 Lake Rd