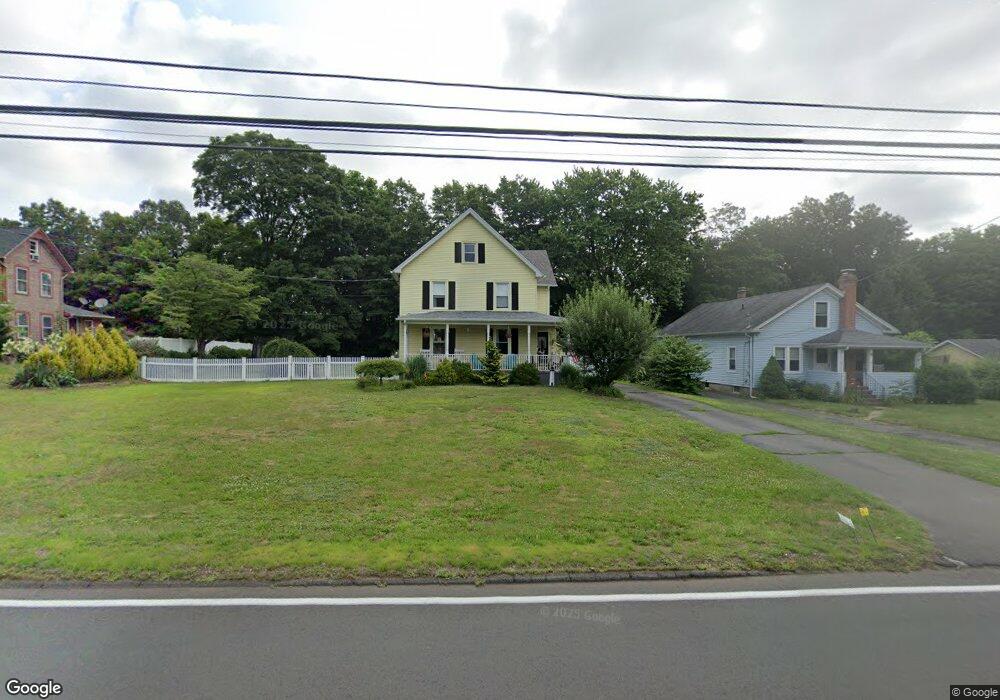
66 Hanover St Wallingford, CT 06492
Estimated Value: $376,000 - $486,000
4
Beds
3
Baths
1,700
Sq Ft
$256/Sq Ft
Est. Value
About This Home
This home is located at 66 Hanover St, Wallingford, CT 06492 and is currently estimated at $434,491, approximately $255 per square foot. 66 Hanover St is a home located in New Haven County with nearby schools including Highland Elementary School, Mary G. Fritz Elementary School, and James H. Moran Middle School.
Ownership History
Date
Name
Owned For
Owner Type
Purchase Details
Closed on
Oct 22, 2009
Sold by
Chick Harold R and Chick Marjorie L
Bought by
Miller Sarah
Current Estimated Value
Home Financials for this Owner
Home Financials are based on the most recent Mortgage that was taken out on this home.
Original Mortgage
$206,000
Outstanding Balance
$134,583
Interest Rate
5.09%
Estimated Equity
$299,908
Purchase Details
Closed on
Apr 24, 2009
Sold by
Us Bank Na
Bought by
Chick Harold R and Chick Marjorie L
Purchase Details
Closed on
Feb 2, 2009
Sold by
Southworth Brian
Bought by
Us Bank Na
Purchase Details
Closed on
Aug 24, 2006
Sold by
Spurr Tr Ronald S and Spurr Roger H
Bought by
Southworth Brian
Home Financials for this Owner
Home Financials are based on the most recent Mortgage that was taken out on this home.
Original Mortgage
$225,620
Interest Rate
6.83%
Create a Home Valuation Report for This Property
The Home Valuation Report is an in-depth analysis detailing your home's value as well as a comparison with similar homes in the area
Home Values in the Area
Average Home Value in this Area
Purchase History
| Date | Buyer | Sale Price | Title Company |
|---|---|---|---|
| Miller Sarah | $257,500 | -- | |
| Miller Sarah | $257,500 | -- | |
| Chick Harold R | $141,000 | -- | |
| Chick Harold R | $141,000 | -- | |
| Us Bank Na | -- | -- | |
| Us Bank Na | -- | -- | |
| Southworth Brian | $237,500 | -- | |
| Southworth Brian | $237,500 | -- |
Source: Public Records
Mortgage History
| Date | Status | Borrower | Loan Amount |
|---|---|---|---|
| Open | Southworth Brian | $206,000 | |
| Closed | Southworth Brian | $206,000 | |
| Previous Owner | Southworth Brian | $225,620 |
Source: Public Records
Tax History
| Year | Tax Paid | Tax Assessment Tax Assessment Total Assessment is a certain percentage of the fair market value that is determined by local assessors to be the total taxable value of land and additions on the property. | Land | Improvement |
|---|---|---|---|---|
| 2025 | $6,247 | $259,000 | $92,400 | $166,600 |
| 2024 | $5,599 | $182,600 | $77,000 | $105,600 |
| 2023 | $5,357 | $182,600 | $77,000 | $105,600 |
| 2022 | $5,303 | $182,600 | $77,000 | $105,600 |
| 2021 | $5,154 | $180,700 | $77,000 | $103,700 |
| 2020 | $5,108 | $175,000 | $76,200 | $98,800 |
| 2019 | $5,108 | $175,000 | $76,200 | $98,800 |
| 2018 | $5,012 | $175,000 | $76,200 | $98,800 |
| 2017 | $4,996 | $175,000 | $76,200 | $98,800 |
| 2016 | $4,881 | $175,000 | $76,200 | $98,800 |
| 2015 | $4,807 | $175,000 | $76,200 | $98,800 |
| 2014 | $4,706 | $175,000 | $76,200 | $98,800 |
Source: Public Records
Map
Nearby Homes
- 13 Bailey Ave
- 15 Hanover St
- 1 Bertini Ln
- 84 Staffordshire Commons Dr
- 396 Main St Unit 2
- 26 Cassella Dr
- 72 Staffordshire Commons Dr
- 380 Main St Unit 3
- 380 Main St Unit 7
- 380 Main St Unit 4
- 380 Main St Unit 16
- 380 Main St Unit 13
- 380 Main St Unit 14
- 3 Pamela Dr
- 54 High St
- 1012 Old Colony Rd Unit LOT 81
- 230 Main St Unit 63
- 230 Main St Unit 18
- 4 Gregory Rd
- 212 Old Stagecoach Rd
Your Personal Tour Guide
Ask me questions while you tour the home.