C
Seller's Agent in 2015
Chris Perchard
Real Living Realty Group
Estimated Value: $851,312 - $900,000
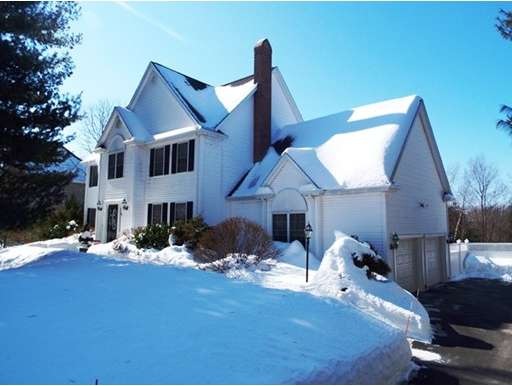
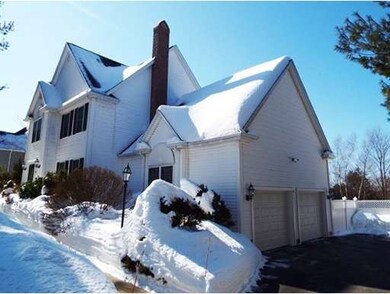
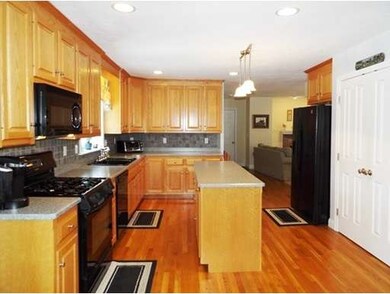
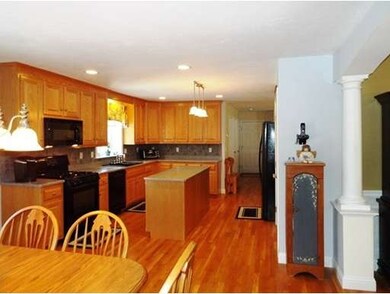
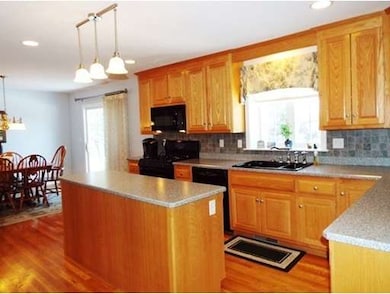
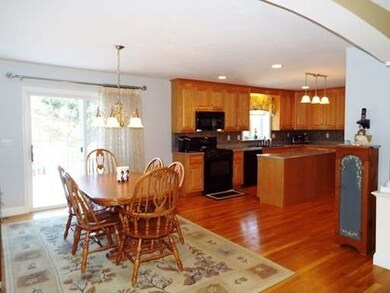
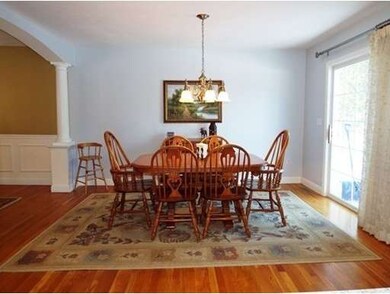
Here's the home you've been waiting for. Young colonial located in Bellingham's desirable Highridge neighborhood. This 4 bedroom 2 1/2 bath home offers lots of space for everyone. The first floor is open and versatile, with a large cabinet packed eat in kitchen, pantry, quaint living room that offers a warming fireplace and a large dining room that can handle any type of gathering. Upstairs you'll find 4 large bedrooms including a master that boasts a vaulted ceiling, large walk in closet and a master bath that is a spa-like retreat. If all that space isn't enough, the basement is finished with approximately 950 additional sq ft and tons of closet space. The potential is unlimited with this large space. The backyard is fully fenced in for privacy and offers a newer above ground pool and a retractable awning over the deck to escape the summer sun. So, if you've been waiting for the perfect home to come on the market in town, don't miss seeing this one.
Last Agent to Sell the Property
Chris Perchard
Real Living Realty Group Listed on: 02/24/2015

Home Type
Single Family
Year Built
2003
Lot Details
0
| Date | Event | Price | List to Sale | Price per Sq Ft |
|---|---|---|---|---|
| 06/22/2015 06/22/15 | Sold | $497,500 | 0.0% | $196 / Sq Ft |
| 06/09/2015 06/09/15 | Pending | -- | -- | -- |
| 04/17/2015 04/17/15 | Off Market | $497,500 | -- | -- |
| 03/28/2015 03/28/15 | Price Changed | $499,900 | -2.0% | $197 / Sq Ft |
| 02/24/2015 02/24/15 | For Sale | $509,900 | -- | $201 / Sq Ft |
| Year | Tax Paid | Tax Assessment Tax Assessment Total Assessment is a certain percentage of the fair market value that is determined by local assessors to be the total taxable value of land and additions on the property. | Land | Improvement |
|---|---|---|---|---|
| 2025 | $8,671 | $690,400 | $182,900 | $507,500 |
| 2024 | $8,281 | $643,900 | $167,000 | $476,900 |
| 2023 | $7,976 | $611,200 | $159,000 | $452,200 |
| 2022 | $7,972 | $566,200 | $138,600 | $427,600 |
| 2021 | $7,662 | $531,700 | $138,600 | $393,100 |
| 2020 | $7,299 | $513,300 | $136,400 | $376,900 |
| 2019 | $7,128 | $501,600 | $136,400 | $365,200 |
| 2018 | $7,074 | $490,900 | $148,400 | $342,500 |
| 2017 | $6,856 | $478,100 | $148,400 | $329,700 |
| 2016 | $6,502 | $455,000 | $156,900 | $298,100 |
| 2015 | -- | $436,300 | $156,900 | $279,400 |
| 2014 | $6,101 | $416,200 | $152,600 | $263,600 |
C
Seller's Agent in 2015
Chris Perchard
Real Living Realty Group
Buyer's Agent in 2015
William Loring
William Raveis R.E. & Home Services
(617) 529-1877
28 Total Sales
Source: MLS Property Information Network (MLS PIN)
MLS Number: 71794743
APN: BELL-000081-000001-000052
Disclaimer: Certain information contained herein is derived from information provided by parties other than Homes.com. All information provided is deemed reliable, but is not guaranteed to be accurate and should be independently verified.
![]() The property listing data and information, or the Images, set forth herein were provided to MLS Property Information Network, Inc. from third party sources, including sellers, lessors and public records, and were compiled by MLS Property Information Network, Inc. The property listing data and information, and the Images, are for the personal, non-commercial use of consumers having a good faith interest in purchasing or leasing listed properties of the type displayed to them and may not be used for any purpose other than to identify prospective properties which such consumers may have a good faith interest in purchasing or leasing. MLS Property Information Network, Inc. and its subscribers disclaim any and all representations and warranties as to the accuracy of the property listing data and information, or as to the accuracy of any of the Images, set forth herein.
The property listing data and information, or the Images, set forth herein were provided to MLS Property Information Network, Inc. from third party sources, including sellers, lessors and public records, and were compiled by MLS Property Information Network, Inc. The property listing data and information, and the Images, are for the personal, non-commercial use of consumers having a good faith interest in purchasing or leasing listed properties of the type displayed to them and may not be used for any purpose other than to identify prospective properties which such consumers may have a good faith interest in purchasing or leasing. MLS Property Information Network, Inc. and its subscribers disclaim any and all representations and warranties as to the accuracy of the property listing data and information, or as to the accuracy of any of the Images, set forth herein.